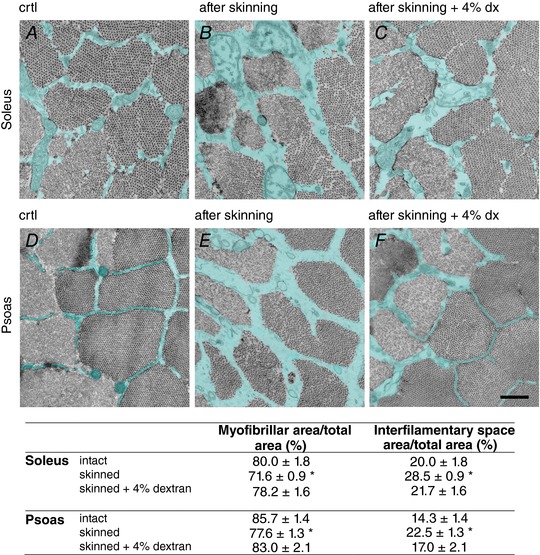
Figure 1. Intermyofibrillar space quantification.

A–F, representative electron micrographs of cross sections of fibres from soleus (upper row) and psoas (lower row) muscles fixed before (A and D) after the skinning procedure (B and E) and after the skinning procedure in the presence of 4% dextran (C and F). The intermyofibrillar space is labelled in cyan. Scale bar: 0.5 μm. The percentage of myofibrillar area and intermyofibrillar space area over the total area are reported in the table for the slow and fast fibres as means ± SEM. Student's t test: * P < 0.05 with respect to the intact value within each fibre type.
