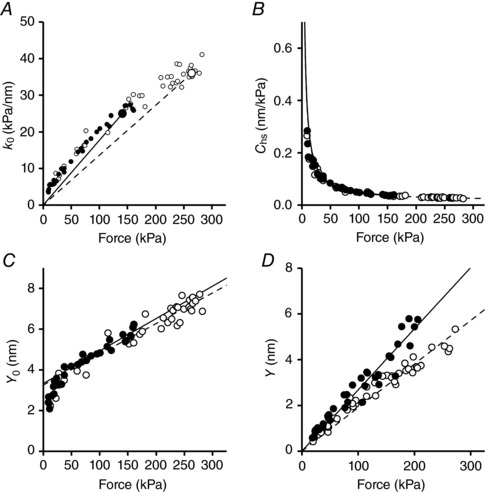
Figure 5. Half‐sarcomere stiffness in isometric contraction and in rigor and derived parameters.

In all panels filled circles and continuous lines refer to slow fibres and open circles and dashed lines to fast fibres. Dependence on force of hs‐stiffness (A), hs‐compliance (B) and hs‐strain (C). The lines in A connect the average T 0,4.5 (larger symbols) with the origin. In C the lines are the linear regression fit to data for forces >40 kPa. In B the lines are calculated with the parameters estimated from the fits in C. D, hs–strain relation in rigor; the lines are the linear regressions fit to data forced to pass through zero. Data from 9 and 10 fibres for soleus and psoas, respectively.
