
Figure 5. Both Shank3 Δ13–16 and HCN2 knockout neurons show hyperpolarizing shift in resting membrane potential and increase in input resistance, in contrast to Shank3 Δ4–9 neurons.
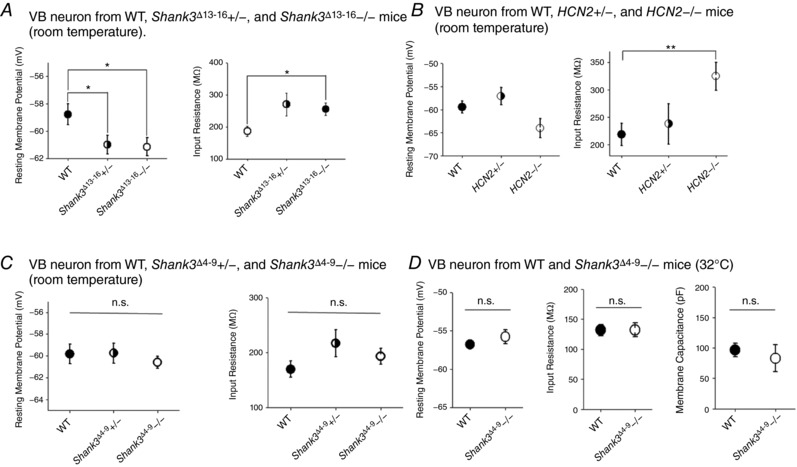
A, VB neurons from both heterozygous and homozygous Shank3 Δ13–16 mice show significantly more negative RMP (left) and increased R in (right). WT, n = 9; Shank3 Δ13–16+/−, n = 11; Shank3 Δ13–16−/−, n = 12. B, VB neurons from HCN2 heterozygous and homozygous mice show almost the same trend of changes compared to Shank3 Δ13–16 neurons. Left, RMP; right, R in. WT, n = 8; HCN2+/−, n = 8; HCN2−/−, n = 7. C, the RMP (left) and R in (right) of VB neurons from Shank3 Δ4–9 heterozygous and homozygous mice remained largely normal. All results were collected at room temperature. WT, n = 6; Shank3 Δ4–9+/−, n = 13; Shank3 Δ4–9−/−, n = 9. All n.s. D, the RMP (left), R in (middle), and the membrane capacitance (right) of VB neurons from Shank3 Δ4–9 homozygous mice remained largely normal compared to WT mice. Results were collected at 32°C. All n.s. WT, n = 9; Shank3 Δ4–9−/−, n = 8.