
Figure 7. VB neurons from Shank3 Δ4–9 homozygous knockout mice show almost normal tonic and burst AP firing.
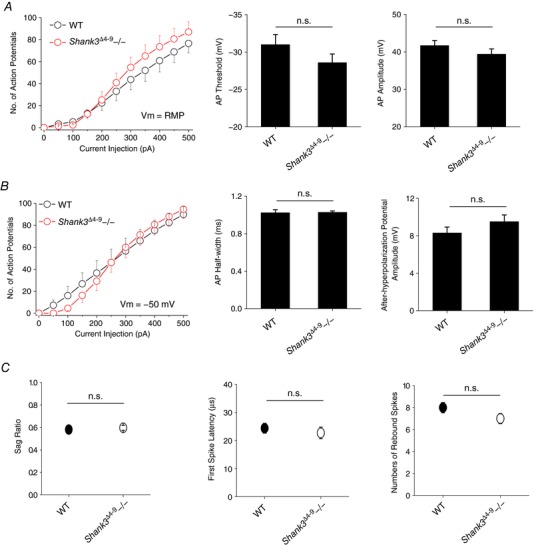
A, tonic action potential firing at resting membrane potential. Left, number of APs vs. amplitude of injected current. Right, summary of AP threshold and AP number. All n.s. B, tonic action potential firing with membrane potential adjusted to −50 mV. Left, number of APs vs. amplitude of injected current. Right, summary of AP half‐width and AHP amplitude. All n.s. C, summary of sag ratio (left), first spike latency (right), and number of rebound spikes (left). WT, n = 9; Shank3 Δ4–9−/−, n = 8. All n.s. [Color figure can be viewed at http://wileyonlinelibrary.com]