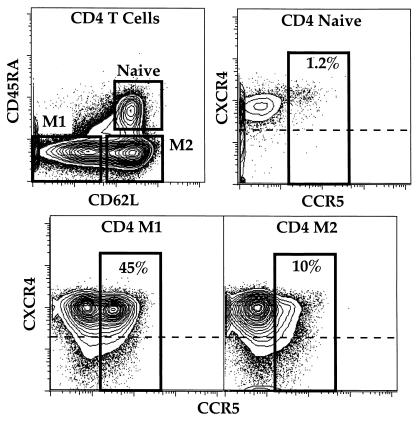
Figure 1.
Flow cytometric analysis of CD4 T cell subpopulations. Fresh total PBMC isolated from healthy uninfected individuals were stained with antibodies to CCR5 (FITC), CXCR4 (PE), CD3 (Cy5PE), CD4 (Cy7PE), CD8 (Cy5.5APC), CD45RA (Cascade blue), and CD62L (Cy5.5PE) as described in Materials and Methods. Naive, M1 and M2 CD4 T cells are identified on the basis of expression of CD45RA and CD62L (Upper Left). The other plots show the expression of CXCR4 and CCR5 on gated subsets of CD4 T cells. Numbers indicate the percentage of each subset that expresses CCR5. Cells above the dashed line express CXCR4; as expected, a majority of all subsets are CXCR4+. The antibody for CCR5 (2D7) binds competitively with CCR5 ligands; however, there are no chemokines in these unstimulated cultures so no blocking can occur.

