. 2018 Mar 16;6(3):e62. doi: 10.2196/mhealth.6432
©Imran Ahmed, Niall Safir Ahmad, Shahnaz Ali, Shair Ali, Anju George, Hiba Saleem Danish, Encarl Uppal, James Soo, Mohammad H Mobasheri, Dominic King, Benita Cox, Ara Darzi. Originally published in JMIR Mhealth and Uhealth (http://mhealth.jmir.org), 16.03.2018.
This is an open-access article distributed under the terms of the Creative Commons Attribution License (https://creativecommons.org/licenses/by/4.0/), which permits unrestricted use, distribution, and reproduction in any medium, provided the original work, first published in JMIR mhealth and uhealth, is properly cited. The complete bibliographic information, a link to the original publication on http://mhealth.jmir.org/, as well as this copyright and license information must be included.
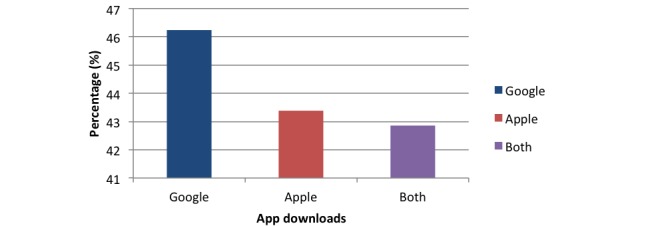
Figure 6.

Chart comparing behavioral method percentage among apps in different app stores.
