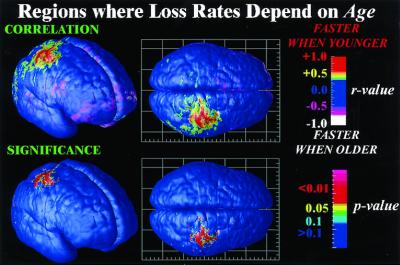
Figure 4.
Mapping nonlinear brain changes and age effects. Dependencies between the rate of gray matter loss and the patient's age are mapped locally and visualized. Parietal regions lose gray matter faster in younger patients (red; r > 0.8; P < 0.001), consistent with an earlier timing of deficits and a slowing of the rates of progression as adolescence continues.

