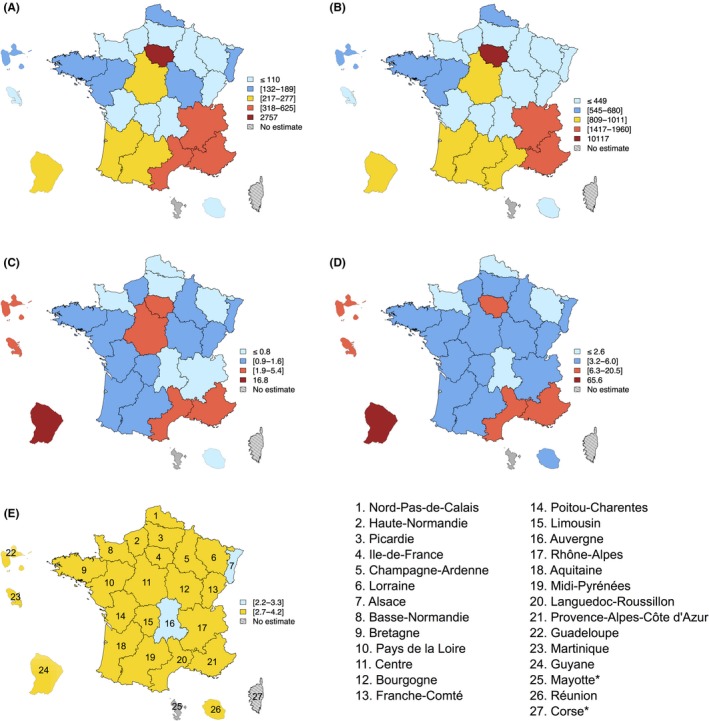
Figure 1.

Subnational estimates for France. (A) Number of new HIV infections in 2014; (B) number of undiagnosed HIV infections in 2014; (C) number of new HIV infections per 10,000 inhabitants (aged 18 to 64 years old) in 2014; (D) number of undiagnosed HIV infections per 10,000 inhabitants (aged 18 to 64 years old) in 2014; (E) median time between infection and diagnosis (in years) for individuals infected between 2011 and 2014. *We could not provide estimates for Corse and Mayotte because of incomplete surveillance data. In (A) and (B), yellow‐coloured regions correspond to regions with numbers close to average number of new infections individuals in A (i.e. 6607/27≈245) and undiagnosed HIV individuals in B (i.e. 24,197/27 ≈ 896), and in (E) to regions with distributions of times from infection to diagnosis not statistically different than the national‐level distribution; Estimated national rates were 1.7 per 10,000 (95% CI: 1.5 to 1.8) for HIV incidence, 6.1 per 10,000 (95% CI: 5.7 to 6.6) for undiagnosed HIV infections and the national‐level median time between infection and diagnosis was 3.3 years (interquartile range: 1.2 to 5.7). In (A–D), light blue (respectively dark blue) coloured regions correspond to regions with numbers or rates more than twice lower (respectively less than twice lower) than average numbers or national rates, while dark red (respectively light red) coloured regions correspond to regions with numbers or rates more than nine times higher (respectively less than nine times higher) than average numbers or national rates. In (E), light blue‐coloured regions correspond to regions with distribution of times from infection to diagnosis statistically different than the national‐level distribution, with values for the median lower than or equal to that of the national level. The maps were produced using the package maptools in R 3.2.4 39.
