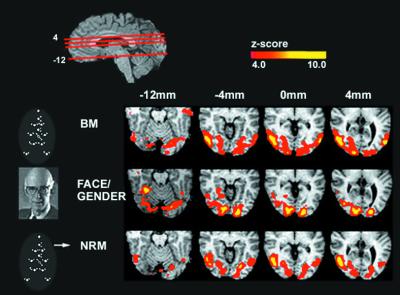
Figure 1.
Comparison of activity across the three experiments. The red lines through the top sagittal slice indicate the position of the axial slices in the figure. A schematic of the three stimuli used is shown on the left. On the right are displayed correlated group z maps showing statistically significant neural activity for each experiment. To generate these z maps for each experiment, a t test was performed to contrast each experiment's task with the control (letter discrimination at fixation). Results from individual subjects were combined to generate group results (see data analysis). The color scale represents the z score of the activation (4 < z < 10). The figure illustrates bilateral activations in the lingual and fusiform gyri in all three tasks. The Face-Gender (FG) discrimination task produces significantly stronger activity in these areas than the other two tasks, and BM had stronger activation than NRM (see Table 1). BM and NRM produce selectively strong activation in the hMT+ and the cuneus, and these areas are not significantly activated on the face-gender discrimination task (Table 1).

