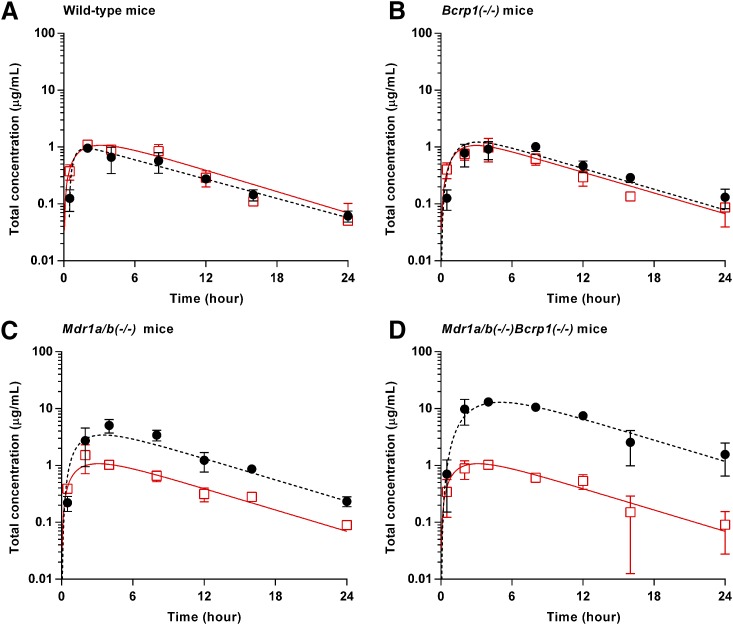
Fig. 7.
Observed (red square) and model-predicted (red solid line) total plasma concentration-time profiles, and observed (black circle) and model-predicted (black dashed line) total brain concentration-time profiles in FVB wild-type (A), Bcrp1(−/−) (B), Mdr1a/b(−/−) (C), and Mdr1a/b(−/−)Bcrp1(−/−) (D) mice (N = 4 at each time point) after a single oral dose (30 mg/kg). The observed data are presented as the mean ± S.D. The observed data for the wild-type were previously reported (Laramy et al., 2017) and were included in this present study to compare with the three other genotypes that lack efflux transporters.

