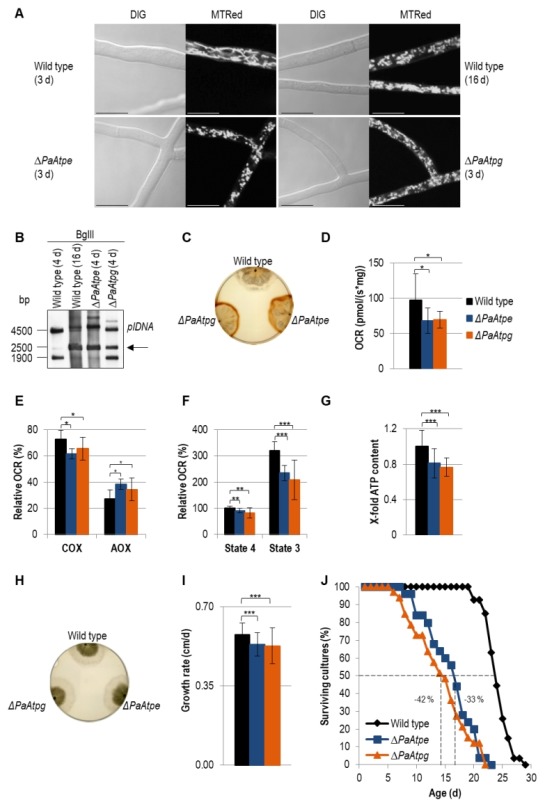
Figure 3. FIGURE 3: Impairments of mitochondrial functions affect growth and lifespan in deletion mutants.

(A) Comparison of mitochondrial morphology of 3-days and 16-days old wild-type strains with those of ΔPaAtpe and ΔPaAtpg (3 d) by fluorescence microscopy. Mitochondria were stained with MitoTracker® Red and analyzed by confocal fluorescence microscopy. Scale bars: 10 µm.
(B) Representative Southern blot analysis of BglII-digested gDNA of wild-type (4-days and 16-days old), ΔPaAtpe and ΔPaAtpg strains (4-days old). The 2500 bp age-specific plDNA (arrow) fragment was detected with a specific plDNA probe.
(C) Release of ROS species H2O2 from wild-type (6-days n=3), ΔPaAtpe (6-days n=3) and ΔPaAtpg strains (6-days n = 3) visualized by DAB precipitation.
(D) Oxygen consumption (basal respiration) of 6-days old deletion mutant mycelium compared to respiration of 6-days old wild type mycelium (n = 3-4 biological replicates with a total number of 12-16 technical replicates).
(E) Relative COX- and AOX-dependent oxygen consumption rate (OCR) of 6-days old wild-type and 6-days old deletion strains mycelium after treatment with KCN (COX-inhibitor) or SHAM (AOX-inhibitor).
(F) Relative complex I-dependent OCR of 6-days old wild-type mitochondria compared to mitochondria from 6-days old deletion mutants (n = 4-8 biological replicates with a total number of 15-28 technical replicates). State 4 OCR of mitochondria from wild type was set to 100%.
(G) ATP production of 6-days old wild-type and 6-days old deletion mutant mitochondria after removal of samples during state 3 respiration measurements. Samples of three biological replicates and two technical replicates, respectively, were measured three times by a luminescence-based assay.
(H) Phenotypic analysis of indicated strains growing on M2 medium for 4 days.
(I) Growth rate of wild type (0.58 ± 0.05 cm/d, n = 27), ΔPaAtpe (0.53 ± 0.05 cm/d, n = 25) and ΔPaAtpg (0.53 ± 0.08 cm/d, n =3 3) growing on M2 medium. Growth rate was determined from day 3 to 6 of growth.
(J) Lifespan analysis of wild type (mean lifespan = 23.3 d, n = 27), ΔPaATPe (mean lifespan = 15.1 d, n = 25,) and ΔPaATPg (mean lifespan = 13.5 d, n = 33) growing on M2 medium. The error bars represent the standard deviation and the P-values were determined by Student´s t test.
