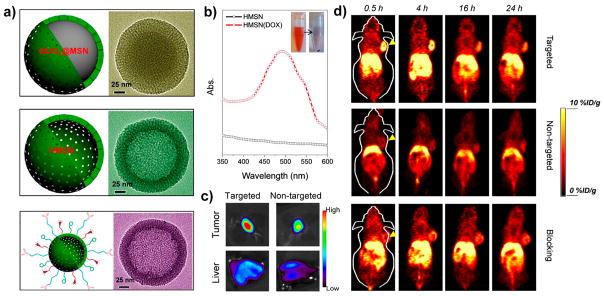
Figure 5.
(a) Schematic (left) and TEM image (right) of single dSiO2@MSN, HMSN, and HMSN-TRC105 NPs. (b) UV–vis spectra of HMSNs with and without DOX in aqueous solution. (c) Ex vivo optical imaging of DOX accumulation in the tumor and liver after intravenous injection of HMSN: targeted, HMSN-TRC105 loaded with DOX; nontargeted, HMSN loaded with DOX. (d) In vivo tumor-targeted PET imaging at different time points p.i. Tumors are indicated by yellow arrowheads. Reproduced with permission from ref 28. Copyright 2015 Nature Publishing Group.

