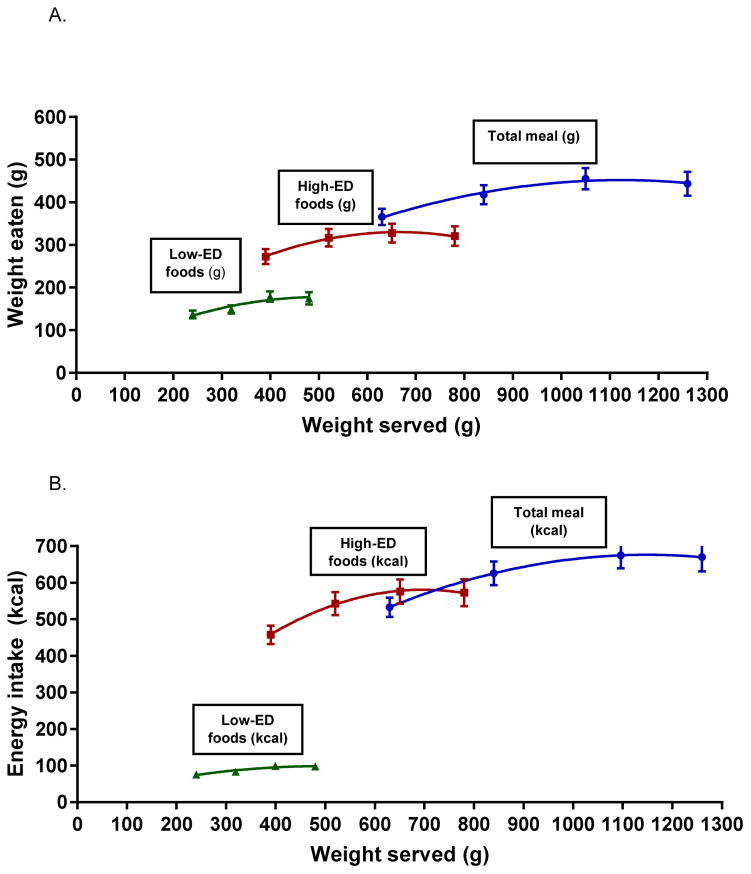
Figure 1.
a) Mean intakes by weight (± SEM) as a function of weight of food served (g) for the total meal and for high-ED and low-ED foods served to 47 children. Mean curves of food intake in response to increases in the weight of food served were modeled using a random coefficient analysis. Individual curves were modeled for each child. The weight of food served significantly influenced intake by weight of the total meal (F1,41=17.9; P < 0.0001), and of high-ED (F1,41=17.1; P < 0.0001) and low-ED (F1,41=8.9; P < 0.005) foods analyzed separately. There were no differences in the intake curves as a function of energy density. b) Mean intakes by kcal (± SEM) as a function of weight of food served (g) for the total meal and for high-ED and low-ED foods served to 47 children. Mean curves of energy intake in response to increases in the weight of food served were modeled using a random coefficient analysis. Individual curves were modeled for each child. The weight of food served significantly influenced energy intake of the total meal (F1,41=20.8; P < 0.0001), and of high-ED (F1,41=17.1; P < 0.0001) and low-ED (F1,41=8.9; P < 0.005) foods analyzed separately.

