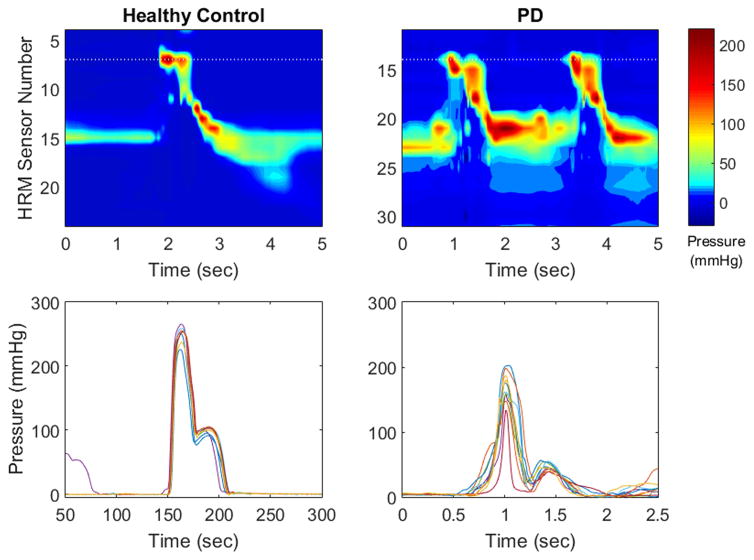
Figure 3.
High-resolution manometry spatiotemporal plots (top row) and single sensor pressure waveforms (bottom row) from a healthy control participant (left column) and a participant with Parkinson’s disease (right column). Pressure waveforms display pressure variability from one sensor in the velopharynx (marked with a dotted line on the spatiotemporal plot) over 10 swallows. Variability is higher in the participant with PD. HRM = high resolution manometry; PD = Parkinson’s disease.

