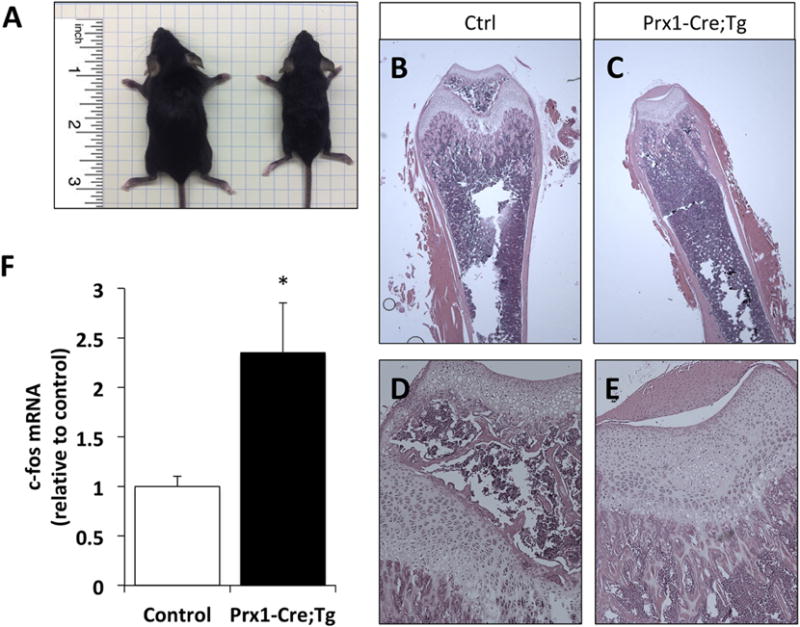
Figure 6. Prx1-Cre;Tg mice continues to be smaller than control littermates at postnatal day 21, with delayed endochondral ossification and increased c-fos mRNA levels in BMSCs.

(A) Gross phenotypes of 3-week old control (on the left) and Prx1-Cre; Tg (on the right) littermates. (B–E) Hematoxylin and eosin stained femur sections of control (B,D) and Prx1-Cre;Tg mice (C,E). Images were captured at 2× (B,C) or 10× (D,E) magnification. Note the absence of secondary ossification center in Prx1-Cre;Tg samples (Panels C and E). (F) Elevated levels of c-fos mRNA in BMSCs from Prx1-Cre; Tg compared to control littermates, measured by using qRT-PCR and β-actin mRNA as a reference control. Data represent mean ± SEM (n=7); *, p<0.05 vs control (two-tailed Student’s t-test).
