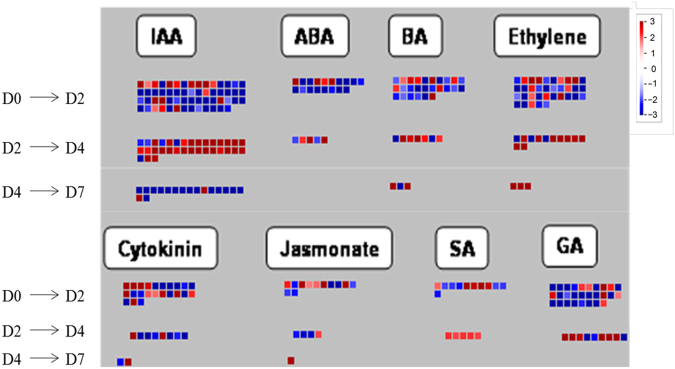
Fig. 4.
Display of gene expression involved in hormone biosynthesis and signaling pathway. Significantly DEGs (log2 fold changes (FC) ≥1, FDR ≤0.05) were visualized using Mapman software and organized into functional categories (BINs)32,33. Blue indicates a decrease and red an increase in gene expression (see color set scale on top right corner). Detailed information on each gene and its expression level is listed in Supplementary Table S2

