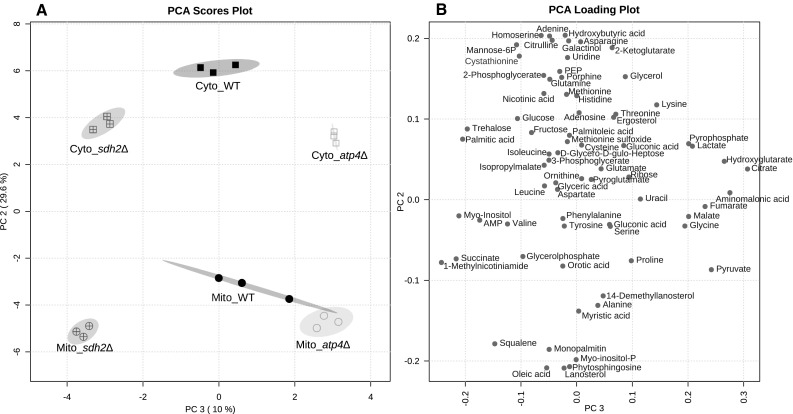
Fig. 4.

a Principal component (PC) analysis plot and b its loading map. PC2 discriminates mitochondria (Mito) from the cytoplasm (Cyto), while PC3 discriminates atp4∆ and sdh2∆ from each other and WT. The loading map displays how the individual metabolites contribute to the discrimination. The bigger the absolute PC value of a metabolite is, the more it contributes to the discrimination in this PC
