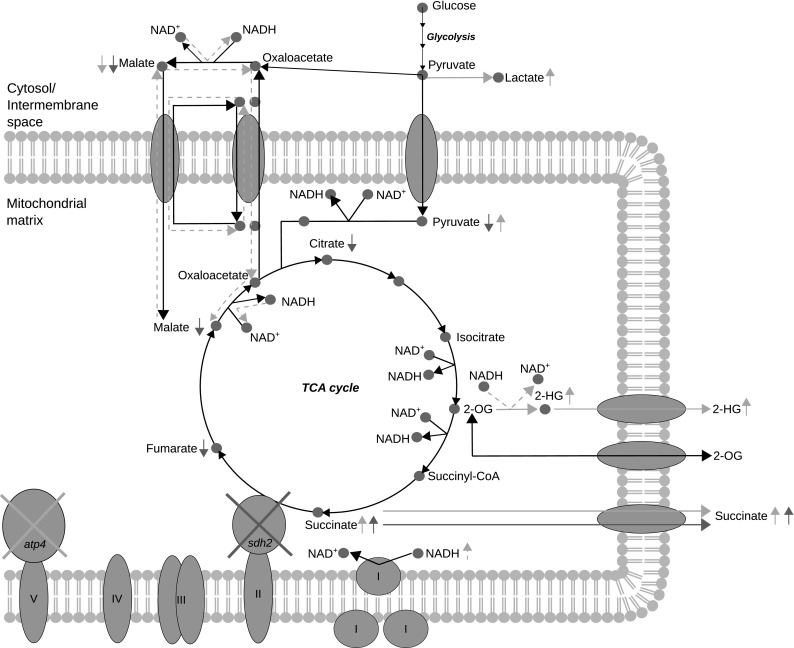
Fig. 6.

Overview of metabolic alterations in mitochondria of sdh2Δ and atp4Δ mutants. The relevant metabolic pathways are shown by solid black lines. The metabolic changes caused by the deletion of SDH2 or ATP4 are displayed by either purple for sdh2Δ or deep yellow for atp4Δ. The colored solid lines indicate the observed metabolic dysregulations and the dashed lines indicate the putative related metabolic changes (hypothesis of the authors)
