Figure 4.
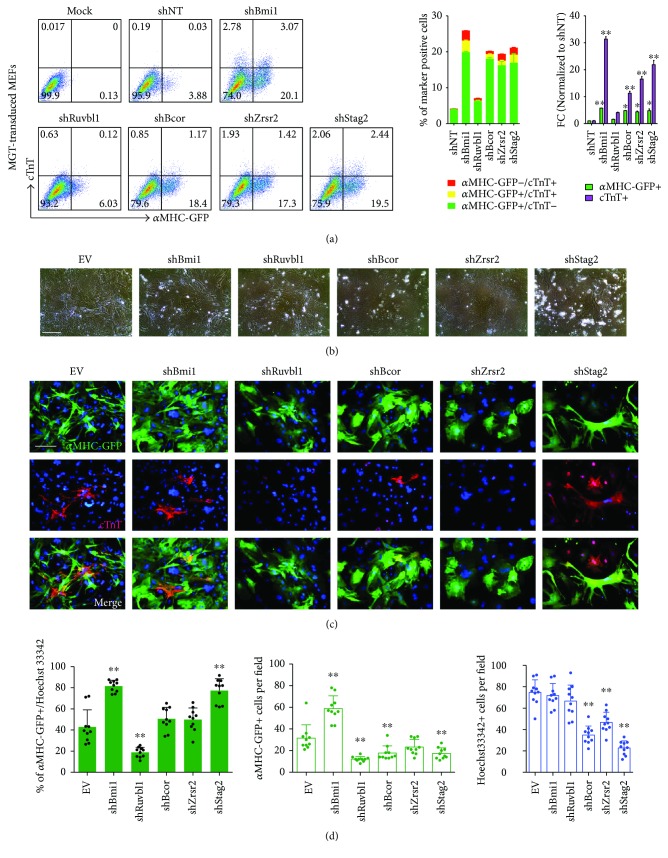
Knockdown of Bcor/Zrsr2/Stag2 promoted iCM conversion from MEFs. (a) Representative flow plots (left) and quantification (right) for αMHC-GFP+ and/or cTnT+ cells on MEFs after infection of MGT with indicated shRNA lentiviruses for 10 days. (b) Representative phase-contrast images of MGT-infected MEFs at day 10 after transduction of shRNAs as indicated. EV, empty vector, was used as a negative control. (c) Representative ICC images for αMHC-GFP or cTnT expressed iCMs derived from MEFs transduced with MGT and indicated shRNAs at reprogramming day 10. EV, empty vector, was used as a negative control. (d) Quantification for αMHC-GFP+ cells and total cells indicated by Hoechst 33342 in (c). ∗ p < 0.05, ∗∗ p < 0.01.

