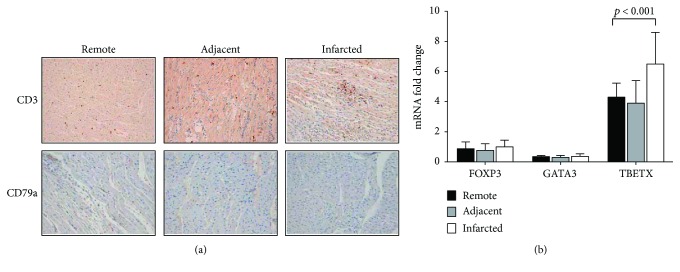
Figure 3.
T cell infiltration and lymphocyte apoptosis in swine myocardial samples. (a) Microscopic captions of porcine myocardium; top: T cell (CD3) infiltration; bottom: B cell (CD79a) in infarcted, adjacent, and remote areas. (b) T cell subset gene expression: FOXP3, GATA 3, and TBETX in infarcted, adjacent, and remote areas. Data are expressed as mean ± SD. ∗ p < 0.05 versus remote. SD: standard deviation.

