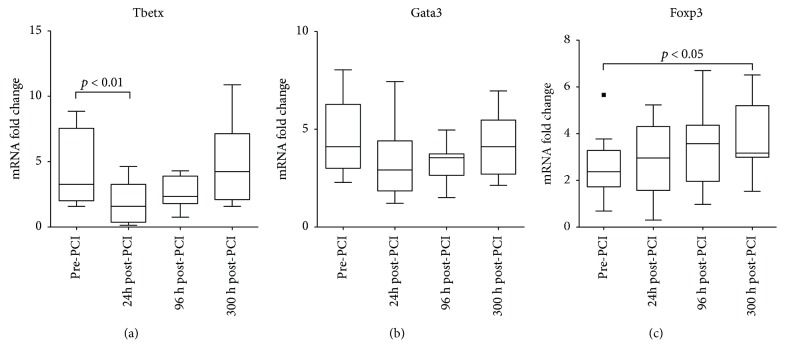
Figure 5.
CD4 T cell subsets dynamics in STEMI patients. mRNA gene expression analysis of the dynamics of different CD4 subsets in STEMI patients. Tbetx gene expression indicates Th1 cells, Gata3 gene expression indicates Th2 cells, and FOXP3 gene expression indicates Treg cells. A significant decrease of proinflammatory Th1 cells was observed 24 h post-PCI while Treg cells increased within the next month. Values are expressed as mean ± SD. p < 0.05 or p < 0.01 versus pre-PCI. PCI: percutaneous coronary intervention; SD: standard deviation; STEMI: ST-segment myocardial infarction.

