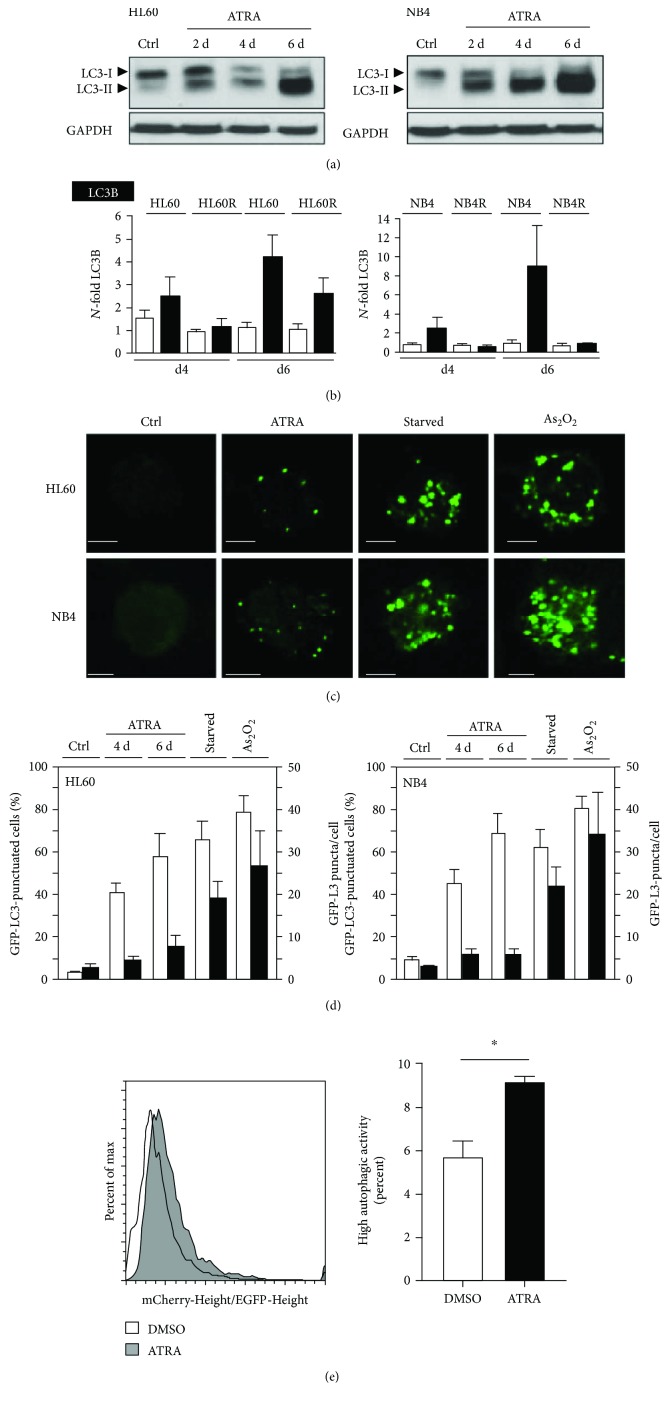
Figure 1.
Autophagy is associated with neutrophil differentiation of AML cells. (a) ATRA differentiation induces LC3B lipidation measured by Western blotting. HL60 AML and NB4 APL cells were treated with 1 μM ATRA for up to 6 days. GAPDH was used as a loading control. (b) qPCR analysis of LC3B mRNA of HL60 and NB4 as well as ATRA-resistant HL60-R and NB4-R2 cells after 4 and 6 days of ATRA treatment, respectively. Data are shown as N-fold activation compared to untreated cells at days 4 and 6. (c) ATRA differentiation induces GFP-LC3 dot formation. NB4 and HL60 cells stably expressing GFP-LC3 were treated with 1 μM ATRA, starved for 8 hours, or treated with 6 (NB4) and 12 μM (HL60) arsenic trioxide (As2O3), respectively. GFP-LC3 puncta were detected using confocal microscopy. Scale bar 10 μm. (d) Treatment as in (c). Results are expressed as percentage of cells showing punctuated GFP-LC3 staining and as average number of puncta per cell. Counts are mean ± s.e.m.; n = 100; three independent experiments. (e) FACS analysis of NB4 cells expressing the tandem construct mCherry-EGFP-LC3B. Left panel: histogram of the mCherry-Height/EGFP-Height ratio in cells treated with vehicle or with ATRA (1 μM) for 48 h. Right panel: percentages represent cells with high autophagic activity based on a threshold set on control cells. Mann–Whitney U test, ∗ p < 0.05.

