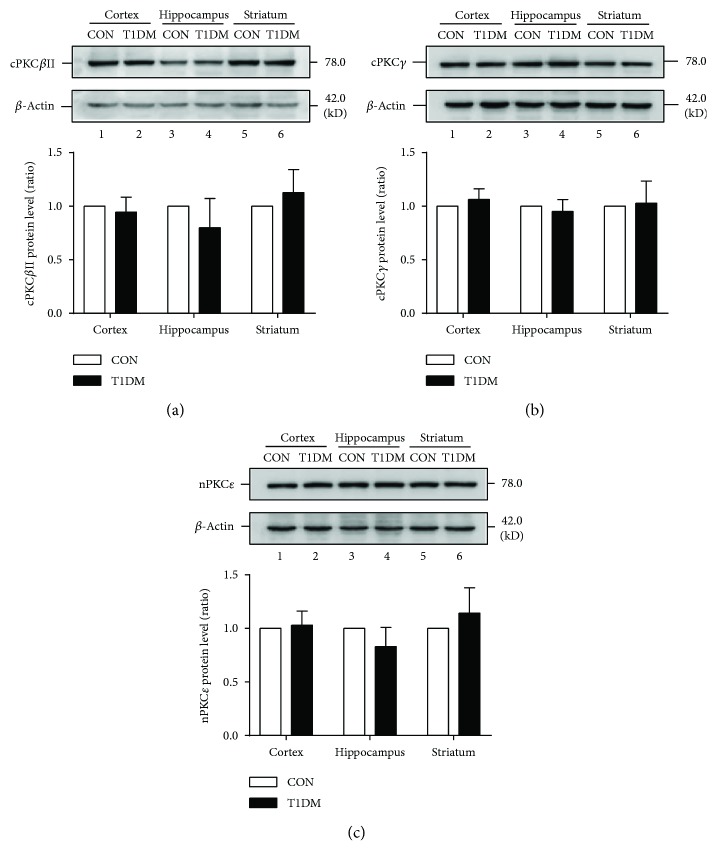
Figure 2.
Expression of PKC isoforms in the cortex, hippocampus, and striatum at 2 weeks after STZ injection. (a) Representative and statistical results of Western blot analysis showed the levels of cPKCβII in the cortex, hippocampus, and striatum at 2 weeks after STZ injection. (b) Representative and statistical results of Western blot analysis showed the levels of cPKCγ in the cortex, hippocampus, and striatum at 2 weeks after STZ injection. (c) Representative and statistical results of Western blot analysis showed the levels of nPKCε in the cortex, hippocampus, and striatum at 2 weeks after STZ injection. n = 6 per group.

