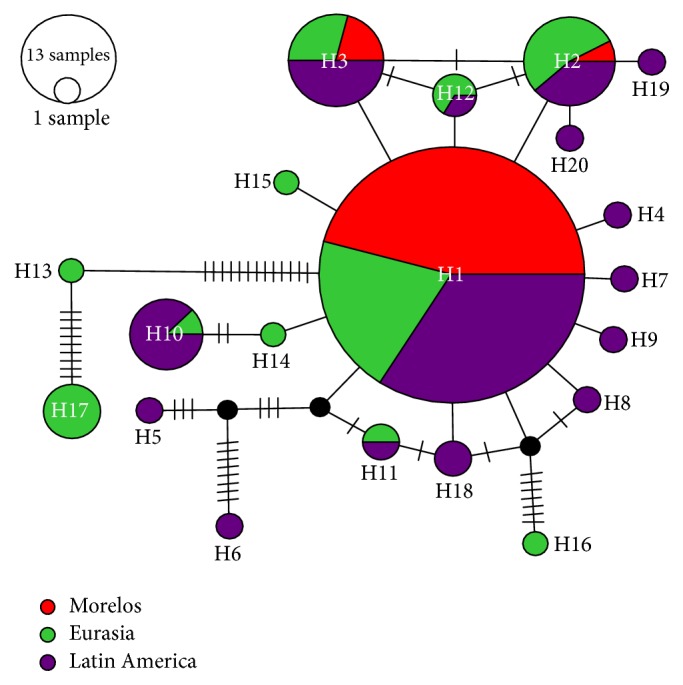
Figure 3.

Haplotype network of Blastocystis ST3 of human populations at different regions from Latin America, Europe, and Asia. Each circle represents a haplotype, and each color represents the place where it was obtained. The size of each circle is proportional to the frequency of the haplotype in each population, where it was found. The circles in black stand for missing haplotypes and the short lines show the mutational steps.
