
Figure 2.
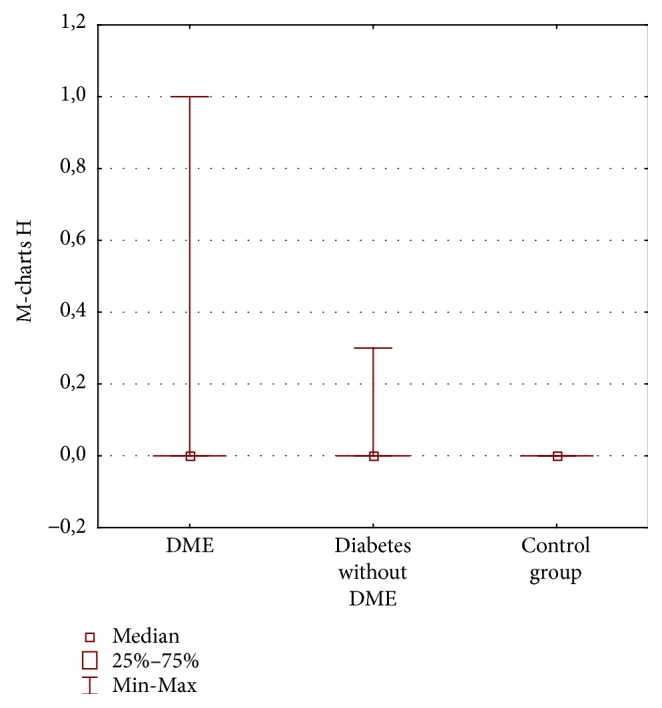
Horizontal (H) M-charts scores (degrees) in three groups of patients: diabetic macular edema (DME), diabetes without DME, and control group.
Official websites use .gov
A
.gov website belongs to an official
government organization in the United States.
Secure .gov websites use HTTPS
A lock (
) or https:// means you've safely
connected to the .gov website. Share sensitive
information only on official, secure websites.
Horizontal (H) M-charts scores (degrees) in three groups of patients: diabetic macular edema (DME), diabetes without DME, and control group.