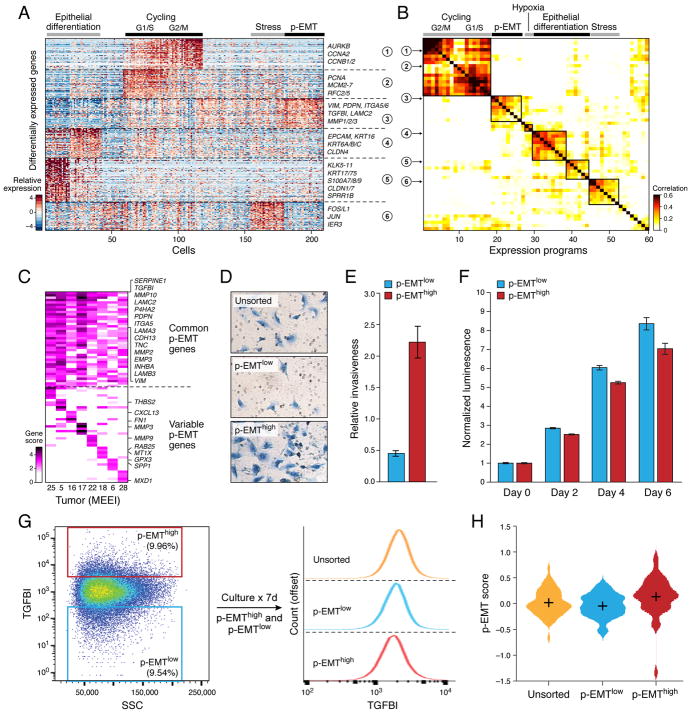
Figure 3. Unbiased clustering reveals a common program of partial EMT (p-EMT) in HNSCC tumors.
(A) Heatmap shows differentially-expressed genes (rows) identified by non-negative matrix factorization (NNMF) clustered by their expression across single cells (columns) from a representative tumor (MEEI25). The gene clusters reveal intra-tumoral programs that are differentially expressed in MEEI25. The corresponding gene signatures are numbered and selected genes indicated (right).
(B) Heatmap depicts pairwise correlations of 60 intra-tumoral programs derived from 10 tumors, as in (A). Clustering identifies seven coherent expression programs across tumors. Rows in the heatmap that correspond to programs derived from MEEI25 are indicated by arrows and numbered as in (A).
(C) Heatmap shows NNMF gene scores (rows) for common (top) and tumor-specific (bottom) genes within the p-EMT program by tumor (columns).
(D) Representative images of SCC9 HNSCC cells sorted by p-EMT marker TGFBI into p-EMThigh and p-EMTlow populations and analyzed by matrigel invasion assay.
(E) Bar plot depicts relative invasiveness of p-EMThigh and p-EMTlow SCC9 cells sorted and analyzed as in (D) (representative experiment; error bars reflect SEM; ANOVA, p<0.005, n=3).
(F) Bar plot depicts relative proliferation of p-EMThigh and p-EMTlow SCC9 cells sorted as in (D) (representative experiment; error bars reflect SEM; ANOVA, p<0.0001, n=4).
(G) (Left) Fluorescence-activated cell sorting plot identifies p-EMThigh and p-EMTlow SCC9 cells isolated based on TGFBI expression. (Right) Histogram (offset) reveals the distribution (x-axis) of TGFBI expression across cells from the respective isolates (p-EMThigh, p-EMTlow, and unsorted; separated by dashed lines). After 7 days in culture, p-EMThigh, p-EMTlow, and unsorted cells have similar distributions of p-EMT marker expression. Additional experiments with the p-EMT marker CXADR demonstrate similar findings (data not shown).
(H) Violin plot depicts p-EMT scores for unsorted, p-EMTlow, and p-EMThigh SCC9 cell sorted and cultured as in (G). Respective isolates largely recapitulate the initial distribution of p-EMT scores.

