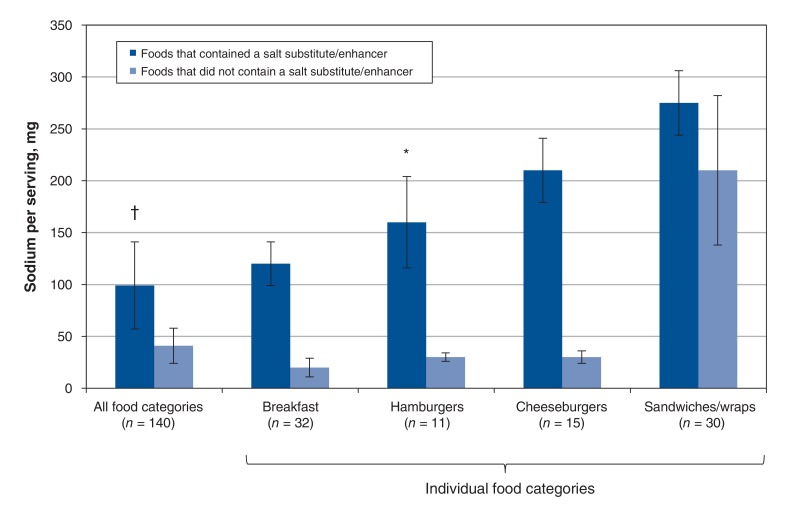
Figure 4.
Magnitude of decrease in sodium (mg/serving) among fast-food items whose sodium level decreased (n = 140). Values are compared for foods in this group that contained a salt substitute/enhancer (n = 99) and foods that did not contain a salt substitute/enhancer (n = 41). Bars represent median ± standard error. *p = 0.01, †p < 0.001, non-parametric Wilcoxon signed-rank tests. "All food categories" includes breakfast items, cheeseburgers, chicken entrées, hot dogs, hamburgers, kids' meals, fries, pizza, poutine, salad entrées with meat, sandwiches/wraps, mashed potatoes, rice, soup and tacos/burritos. Only categories with more than 10 foods are presented individually in this figure. Although the overall study included 222 foods, only 140 foods are represented in this figure because it depicts the analysis only of foods whose sodium level decreased.

