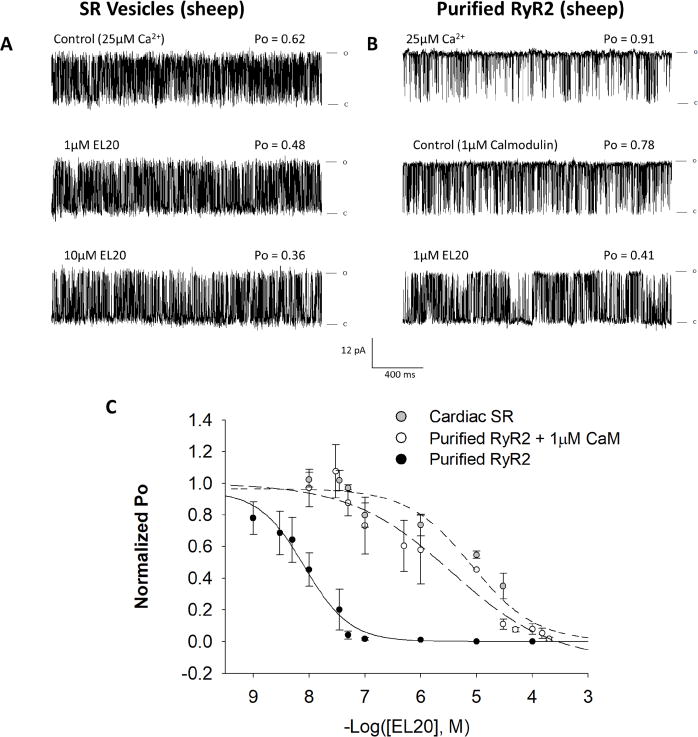
Figure 5.

Inhibition of single-channel activity by EL20. Recordings were made at +36mV in symmetric 250mM KCl, 20mM HEPES, pH 7.4. (A) 2sec traces of single-channel activity of RyR2 from SR vesicles at increasing concentrations of EL20. (B) Purified RyR2 single-channel recording with the addition of 1µM CaM, followed by the addition of EL20. (C) Corresponding dose-response curves for EL20 inhibition of: RyR2 from SR vesicles (grey circles), purified RyR2 + 1µM CaM (open circles), and purified RyR2 without CaM (black circles) (replotted from Fig. 4C). Results are summarized in Table 1. Data is normalized to each channel’s control Po and then grouped and plotted as the mean ± SEM.
