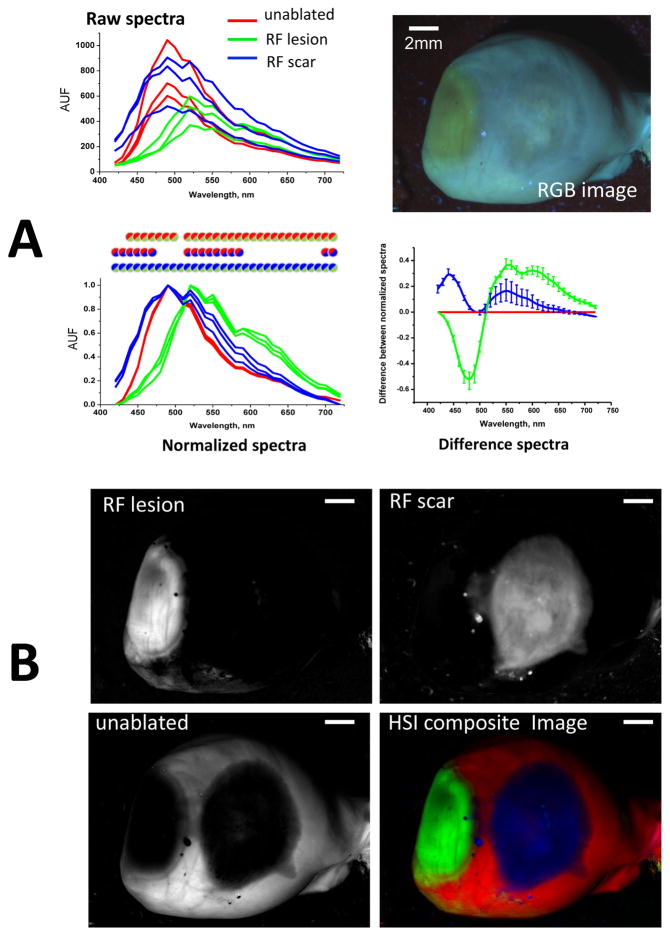
Fig. 4. Spectral changes underlying autofluorescence HSI of saline-perfused hearts.
A. Top: raw spectral traces from three regions-of-interest within unablated, ablated, and scar areas of a saline-perfused, UV-illuminated heart. Bottom: the same spectra but normalized between their respective minima and maxima (circles indicate statistical difference between the two tissue states as per corresponding color). The average differences between the normalized spectra as compared those of unablated tissue are shown on the right.
B. The three grayscale panels correspond to the HSI component images revealed by spectrally unmixing the HSI hypercube. The HSI composite image is shown using pseudocolor. Scale bars - 2mm.

