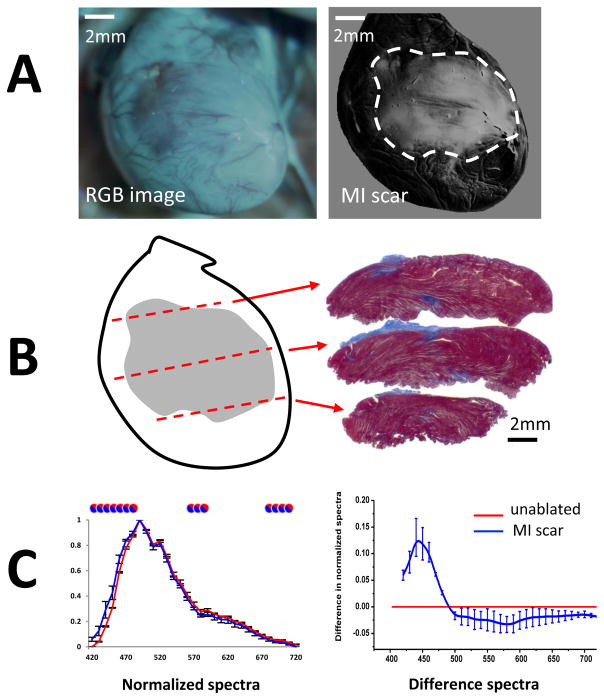
Fig 7. Autofluorescence HSI for in vivo visualization of scar tissue from myocardial infarction.
A. Left: an RGB image showing visual appearance of a scar on a left ventricular surface of a rat as it appears within the open chest of an animal under UV illumination. Right: HSI scar component image.
B. Left: an outline of an HSI-identified scar with dotted lines used to section the heart. Right: Corresponding sections stained with Masson’s blue.
C. Left: normalized spectra from control (red) and scar areas (blue) averaged from three different animals. Circles indicate statistical difference between the two tissue states. Right: The average spectral difference between normalized spectra of scar tissue as compared to unablated tissue (red line).

