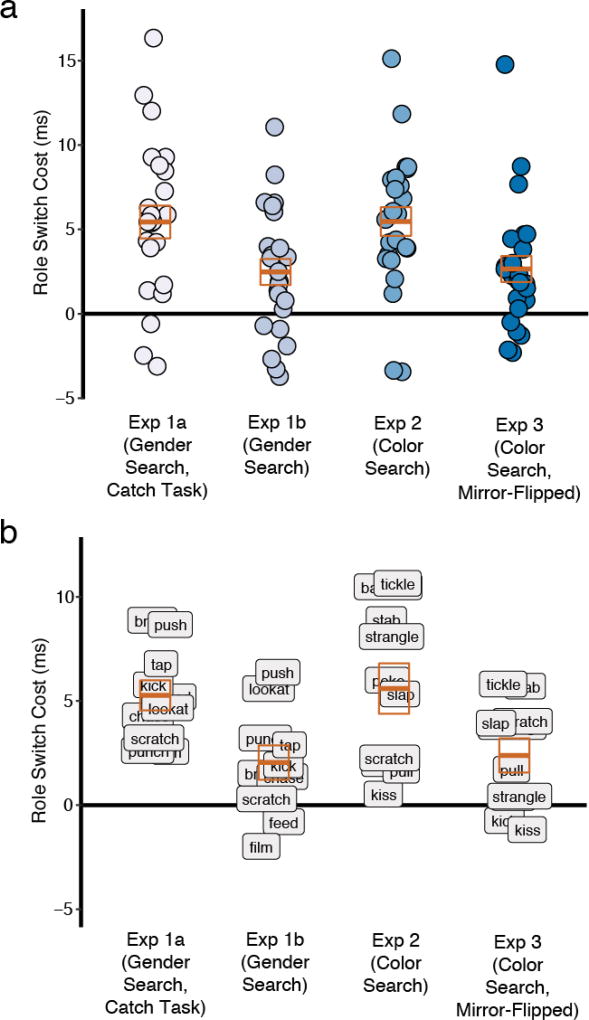
Fig. 3.
Individual (a) subject and (b) item (event category) means for the role switch cost, across all experiments. These plots show the consistency of the role switch cost for both subjects and items: the majority of means are above zero in each case. Orange boxes indicate the mean and standard error across subjects and items, for each experiment.

