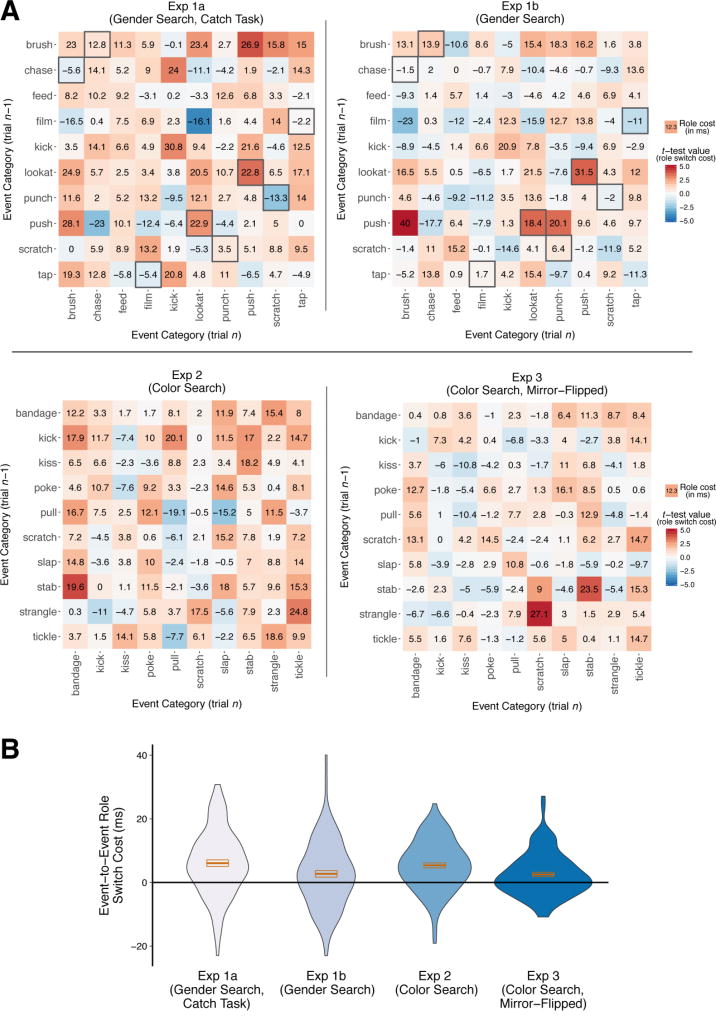
Fig. 5.
(a) Mean role switch cost over subjects (in milliseconds) calculated between each Event Category and every other Event Category, collapsing across Actor Side, separately for each experiment. Color shading indicates t-test values for the switch cost across subjects (|t(23)| > 2.07 is significant at p < .05 uncorrected), with red indicating a role switch cost, and blue a role switch benefit. Gray boxes around cells in Experiment 1a and 1b matrices indicate transitions between different Event Categories that feature the same Actors (see section 2.1.2), which was found in analyses to result in higher switch costs (see section 3.2.1); this is not indicated in Experiments 2 and 3 since there was always only one set of actors. Note that diagonals in each matrix represent the switch cost for the same Event Category, so always reflected the same set of actors, in all experiments. (b) Violin plots of all cells from the four matrices in (a). Violin plot outlines indicate the kernel probability density, i.e. the width of each plot indicates the proportion of event-to-event transition values at each role cost magnitude. Orange boxes indicate the mean and standard error across transition values, for each experiment. Analyses showed that the role switch cost was not driven by a small subset of event-to-event transitions: as can be seen, the majority of values were above zero.

