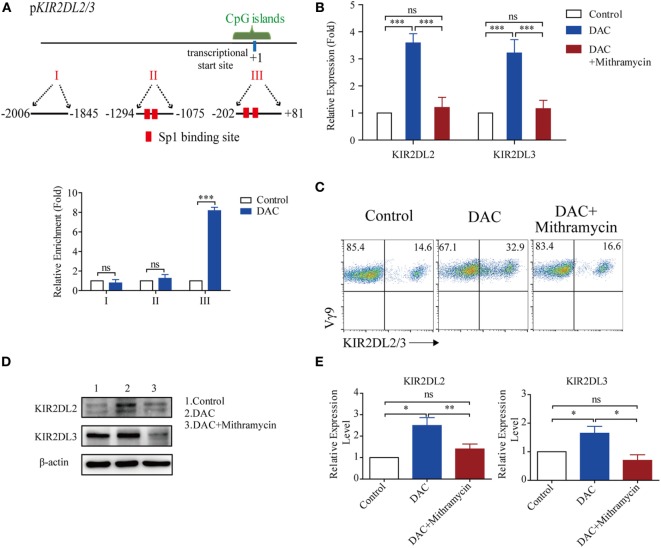
Figure 5.
Decitabine increased KIR2DL2/3 expression by ligation of Sp-1 and its binding sites. (A) Three regions (I, II, and III) including transcriptional star site (+1) of KIR2DL2/3 were analyzed by chromatin immunoprecipitation qPCR for Sp-1 occupancy in KIR2DL2/3 promoter of gamma delta (γδ) T cells treated with and without (control) DAC for 48 h. Data are shown from three independent experiments and each PCR was performed in triplicate (***p < 0.001; ns, not significant). (B) The effect of the Sp-1-inhibitor mithramycin on KIR2DL2 and KIR2DL3 expression in DAC-treated γδ T cells. qRT-PCR analysis of KIR2DL2 and KIR2DL3 expression in γδ T cells, γδ T cells treated with 0.5 µM DAC and γδ T cells treated with 0.5 µM DAC and 100 µM mithramycin for 48 h. Data are expressed as the relative expression of KIR2DL2 and KIR2DL3 mRNA in different groups (***p < 0.001; ns, not significant; n = 3). (C) Flow cytometry analysis of the effect of the Sp-1-inhibitor mithramycin on DAC-treated γδ T cells. γδ T cells were treated with 0.5 µM DAC and 0.5 µM DAC plusing 100 µM mithramycin for 48 h, respectively. Representative FACS results illustrate KIR2DL2 and KIR2DL3 expression on γδ T cells, DAC-treated γδ T cells, and γδ T cells treated with both DAC and mithramycin. (D) Western blot analysis of the effect of mithramycin on DAC-treated γδ T cells. γδ T cells were treated with 0.5 µM DAC and 0.5 µM DAC plusing 100 µM mithramycin for 48 h, respectively. A representative western blot illustrates KIR2DL2 and KIR2DL3 expression on γδ T cells, DAC-treated γδ T cells, and γδ T cells treated with both DAC and mithramycin. β-Actin was used as a loading control of the cell lysates. (E) Bands of KIR2DL2 and KIR2DL3 were quantified by densitometric analysis and plotted after normalization against β-actin. The histogram shows means ± SD for three independent sets of experiments (*p < 0.05; **p < 0.01; ns, not significant).

