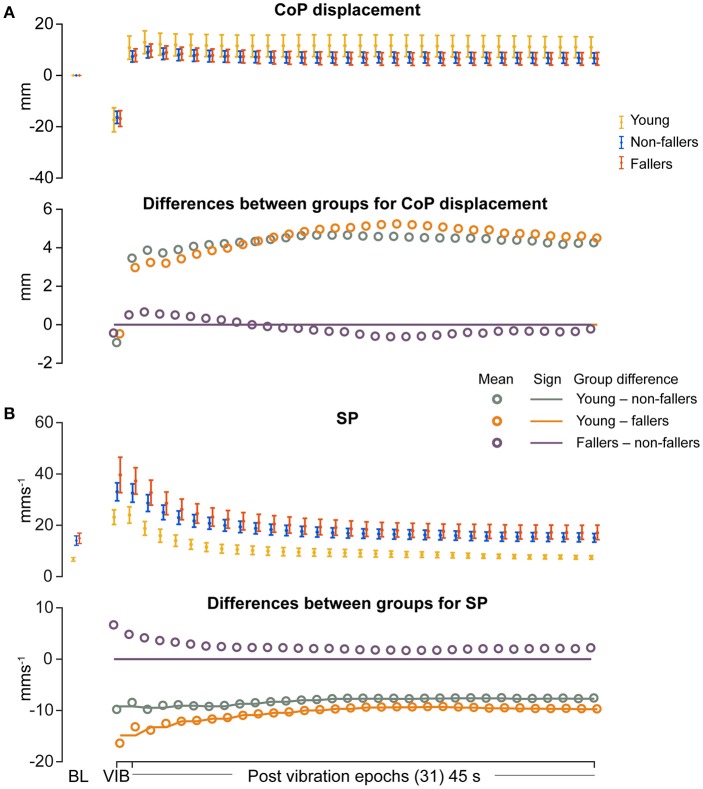
Figure 3.
Results of linear measures during vibration (VIB) and post-vibration epochs. Top panel show mean for each group of (A) mean center of pressure (CoP) displacement and (B) sway path length (SP). Bottom panel in (A,B) show mean differences between groups (open dots), and the significant (sign) difference between groups (solid lines). Note that group differences are significant when the solid line matches the open dots. Group differences at baseline (BL) were assessed separately and are presented for visual reference. Error bars represent 95% confidence interval (1.96 × standard error of measurement).

