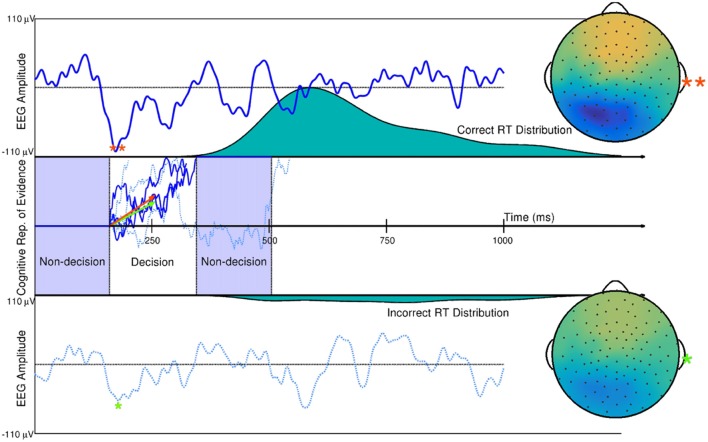
Figure 7.
Single trial ERP influence on DDM parameters. Two trials of a subject’s spatially weight-averaged ERP are shown (top and bottom panels) along with simulations of this subject’s cognitive representation of evidence (middle panel) that are derived from RT distributions. The 10th and 90th percentiles of this subject’s single-trial drift rates (within-trial average evidence accumulation rates in a Brownian motion process as assumed by the DDM) are shown as the orange and green vectors. Results from hierarchical Bayesian modeling suggested that single-trial N200 amplitudes (peaks and spline-interpolated scalp maps denoted by the orange and green asterisks) influence single-trial drift rates (i.e., one latent cognitive parameter that describes the time course and latency of a decision). Using fitted parameters from real data, the larger drift rate is a linear function of the larger single-trial N200 amplitude (**), while the smaller drift rate is a linear function of the smaller N200 amplitude (*). The three dark blue evidence time courses were generated with the larger drift rate (orange vector) which is more likely to produce faster reaction times (where one path describes the time course of the example decision time and subsequent remaining non-decision time in the Middle panel). The three dotted, light blue evidence time courses were generated with the smaller drift rate (green vector) which is more likely to produce slower reaction times. True Brownian motion processes were estimated using a simple numerical technique discussed in Brown et al. (2006). Further explanation of the simulation and model fitting exists in Nunez et al. (2017).

