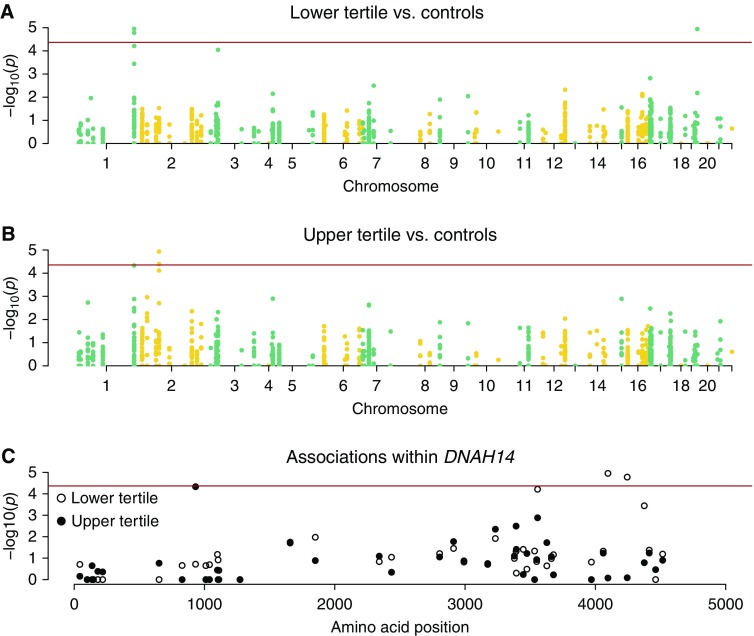
Figure 2.
Single-variant adjusted SKAT-O association test results. (A) Results for the lower SaKnorm (lung function based on forced expiratory volume in 1 s adjusted for age, height, and sex, then mortality among individuals affected by cystic fibrosis) tertile. (B) Results for the upper SaKnorm tertile. (C) Results within a single gene, DNAH14. The red line indicates the Bonferroni significance level. A minor excess of P values near zero for both the lower tertile and the upper tertile versus controls resulted from the comparison of a very small number of cases with a large number of controls.

