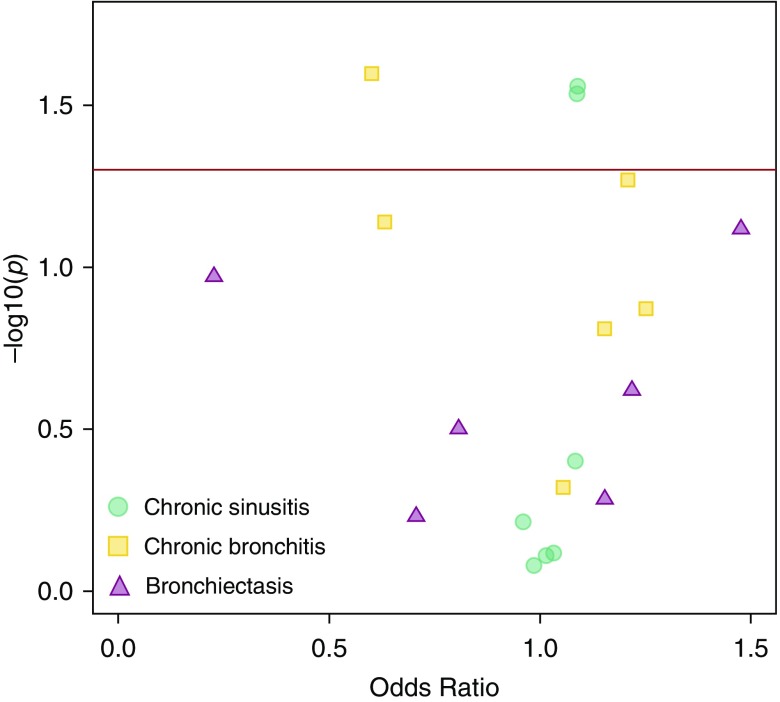
Figure 4.
Association between lung phenotypes in the Marshfield dataset and the variants identified in the discovery cohorts. The data are listed in Table 5. The x-axis is the odds ratio, and the y-axis is the −log10 P value derived by Fisher’s exact test. The red horizontal line represents a P value of 0.05, or nominal significance. Points are color coded by phenotype.

