
Figure 3.
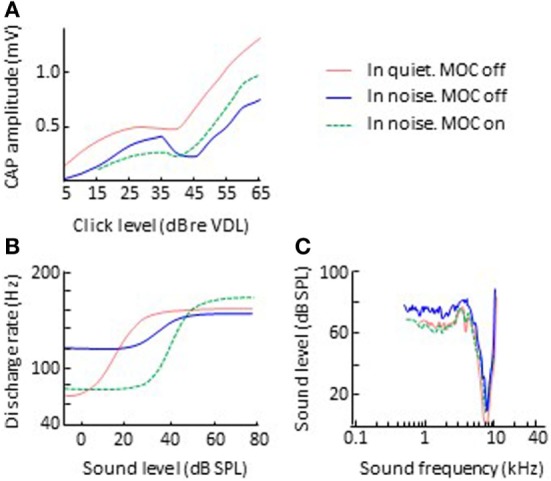
Effects of olivocochlear efferent activation on physiological responses to sound in noise. The left and right panels illustrate corresponding input/output and threshold tuning curves, respectively. (B,C) Single auditory nerve fiber responses. Data in panels (B,C) are re-plotted, in modified form, from Winslow and Sachs (54) and Kawase et al. (55), respectively. (A) CAP. Data in panel A re-plotted, in modified form, from Nieder and Nieder (52). Abbreviations: CAP, compound action potential; VDL, visual detection level.