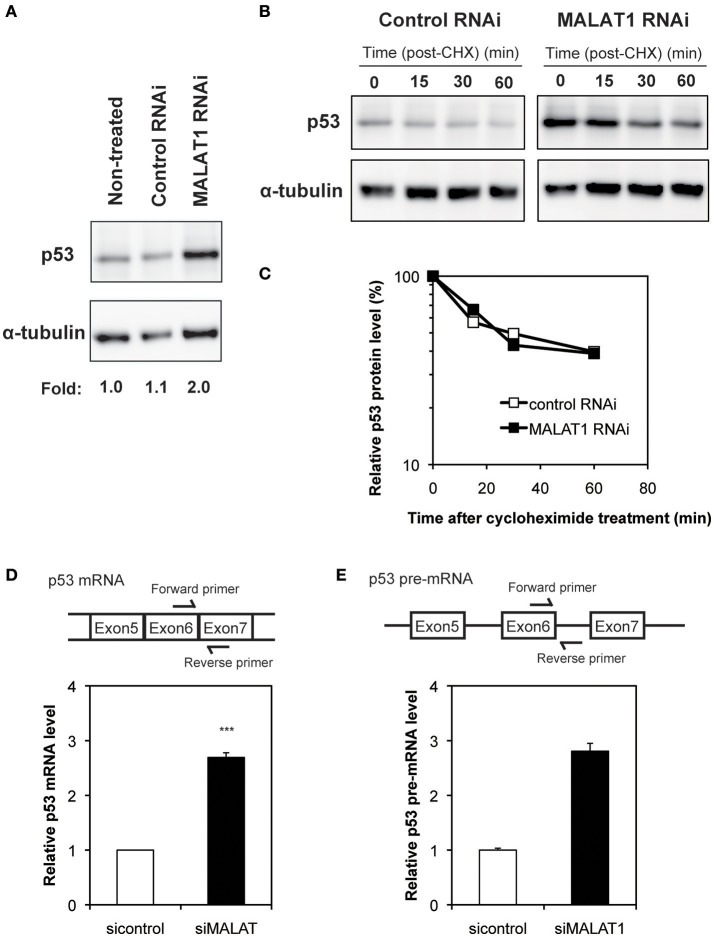
Figure 2.
Increased expression level of p53 in MALAT1-knockdown cells. (A) Expression levels of p53 and α-tubulin were determined by Western blotting. (B) Determination of p53 protein stability in MALAT1-knockdown cells. Cells were treated with cycloheximide (CHX) (100 μM) to inhibit further protein synthesis and harvested at the indicated times. Remained Proteins of p53 and α-tubulin were measured by western blot analysis. The signal intensities of p53 bands were normalized by those of α-tubulin bands. (C) Quantitative analysis of p53 protein levels in (B) using a lumino image analyzer. (D) Expression levels of p53 mRNA were analyzed by real-time RT-PCR. Data are presented as means ± SD of three independent experiments (***P < 0.001, Student's t-test). A schematic diagram to detect matured p53 mRNAs is shown at upper area. (E) Pre-mRNA level of p53 was examined by real-time RT-PCR. Values represent the means ± SD of duplicate measurements. A schematic diagram to detect pre-matured p53 mRNAs is shown at upper area.

