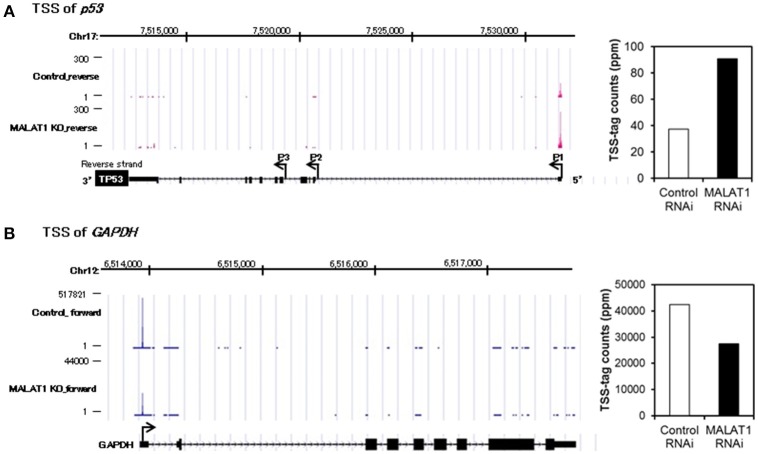
Figure 3.
Transcriptional start site (TSS) analysis in MALAT1-knockdown cells. (A,B) TSS-tags counts mapped at the corresponding genomic regions in p53 (A) or GAPDH (B). The bar graph on the right indicates TSS-tag counts at the position of p53 P1 promoter (A) or GAPDH promoter. TSS-tags belonging to the corresponding TSS clusters were counted. TSS-tag counts were divided by the total number of mapped TSS-tags to calculate TSS-tag ppm (parts per million).

