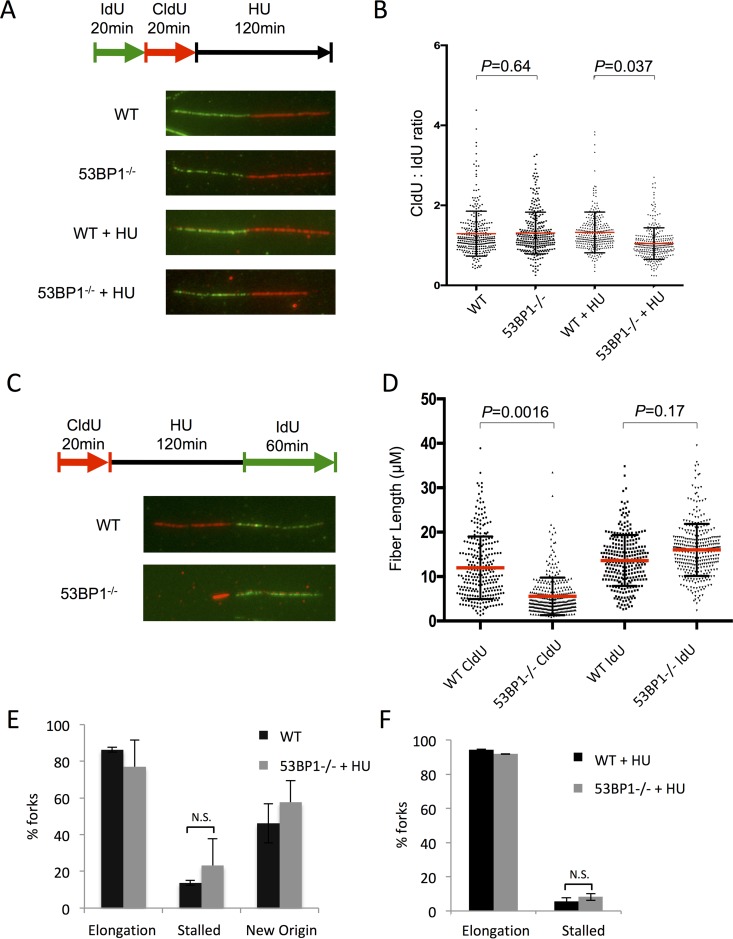
FIG 7.
Replication fork shortening in the absence of 53BP1 after HU treatment. (A) Analysis of nascent DNA tract length in WT and 53BP1−/− splenic B cells. Cells were cultured in vitro for 48 h and then pulsed with IdU, CldU, and HU as shown. Chromatin fibers were prepared and stained to reveal tracts containing IdU as green and CldU as red. (B) Quantification of data from panel A. IdU and CldU tract lengths were measured; ratios of CldU and IdU lengths are shown. Each point represents one fork as measured from 3 separate experiments. The red bars indicate the mean. Error bars represent SDs. P values were calculated using Student's t test. (C) DNA fiber analysis of replication fork restart in WT and 53BP1−/− splenic B cells. Cells were cultured in vitro for 48 h and then pulsed with CldU, HU, and IdU as shown. Chromatin fibers were prepared and stained to reveal tracts containing CldU as red and tracts containing IdU as green. (D) Measurement of initial (CldU+) tract length from protocol as shown in panel C. Each point represents one fork as measured from 3 separate experiments. The red bars indicate the mean. Error bars represent SDs. P values were calculated using Student's t test. (E) Analysis of forks from chromatin fiber protocol as shown in panel C. Forks staining with both CldU+ and IdU+ regions were scored as “elongation” events. Tracts staining for CldU with no IdU staining were scored as “stalled.” Tracts staining for IdU only were scored as “new origin.” The graph shows the mean percentage of forks in each category. More than 2,000 forks were analyzed from 3 separate experiments for each genotype. Error bars represent SDs. (F) Analysis of forks from chromatin fiber protocol as shown in panel C, but with the IdU pulse reduced to 20 min.

