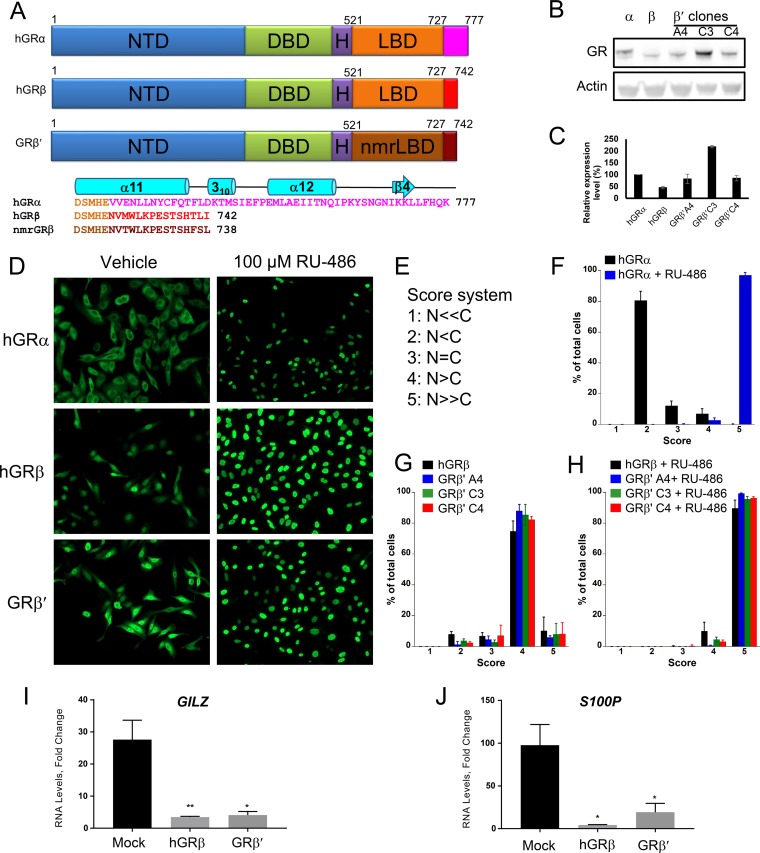
FIG 1.
Functional similarity of the chimeric hGRβ′ (residues 1 to 520)/nmrGRβ (residues 521 to 742) to hGRβ. (A) Schematic representation showing domain structures of hGRα, hGRβ, and hGR1–520/nmrGRβ521–742 (GRβ′). Domains are identified by name and color. Divergent sequences at the C termini of hGRα, hGRβ, and nmrGRβ are shown in pink, red, and dark brown, respectively. The chimeric construct GRβ′ contains human NTD, DBD, and hinge followed by nmrGRβ LBD (dark orange) with the 15 unique amino acid sequence (brown). Secondary structural elements of the hGRα C terminus are shown above its sequence in cyan. (B) Western blot analysis shows the expression level of three stably transfected GRβ′ clones, as well as hGRα and hGRβ in U-2 OS cells. (C) Each protein band intensity was normalized against actin, and the expression level is compared to that of hGRα. The experiment was performed in triplicate, and the data are represented as means ± SD. (D) Immunocytochemistry was conducted using U-2 OS cells stably expressing hGRα, hGRβ, and GRβ′. Representative images are shown for nuclear translocation of each protein in the absence and presence of 100 μM RU-486. (E) Scoring scheme for GR localization. The relative fluorescence intensity ratio of nucleus (N) to cytoplasm (C) was estimated. The lowest number was assigned when receptor was observed to be found predominately in the cytoplasm while the highest number was assigned for those cells whose receptors were found predominately in the nucleus. (F to H) Localization scores are plotted after at least 100 cells were counted from five different images for each treatment. The translocation assay was performed in triplicate, and the data are represented as means ± SD. (I and J) Fold change of mRNA levels of genes GILZ and S100P, regulated by hGRα (mock) in the presence of 100 nM DEX was calculated after hGRβ and GRβ′ were transiently transfected into U-2 OS cells stably expressing hGRα. Experiments were performed in triplicate, and the data are represented as means ± standard errors of the mean (*, P ≤ 0.05; **, P ≤ 0.01).

