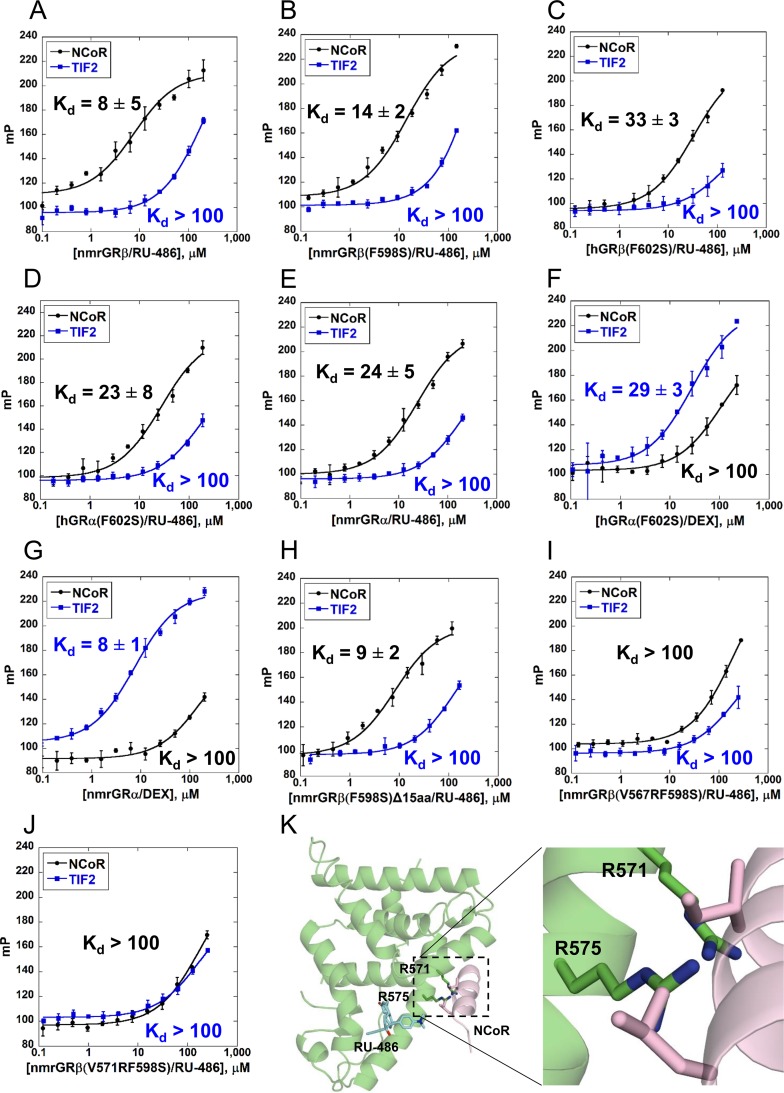
FIG 7.
NCoR and TIF2 peptide interaction with GR LBDs. (A to J) Fluorescence polarization was measured using serially diluted ligand binding domains of the indicated proteins and ligands, in the presence of fluorescein-labeled NCoR (5FAM-ASNLGLEDIIRKALMGSFD) or TIF2 (5FAM-EKHKILHRLLQDSY) peptides. The change in millipolarization (mP) is plotted as a function of the concentration of GR with bound ligand in log scale. Data points are averages of triplicate measurements, and values are shown as means ± SD. Kd values are averaged from triplicate measurements and were estimated after fitting of the binding curves. Kd values that were not measurable due to undersaturation are indicated as >100 μM. (K) Model containing hGRβ with V571R and V575R (equivalent to V567R and V571R in nmrGRβ, respectively) was generated using the crystal structure of nmrGRβ with the corepressor peptide from hGRα (PDB ID 3H52) superimposed.

