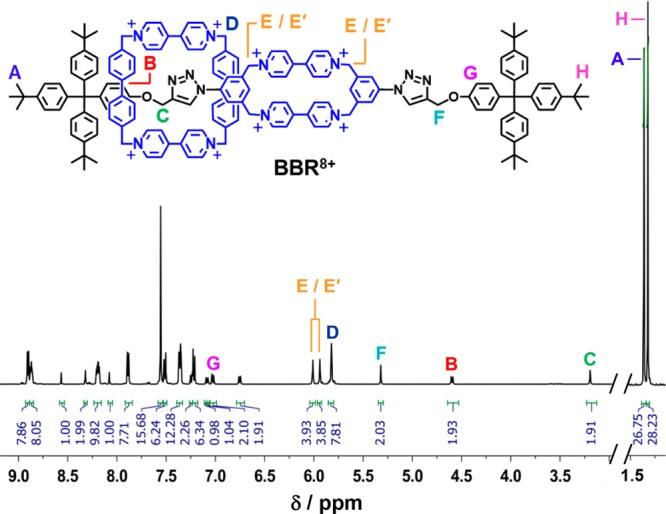
Figure 1.

1H NMR spectrum of a CD3CN solution of BBR·8PF6. The spectrum is abridged in the region of the residual CD2HCN and HOD resonances, while all of the signals for the BBR8+ cation are displayed. Selected resonances are labeled in order to illustrate the coconstitutional asymmetry of the rotaxane. See Figure S1 for full 1H NMR spectroscopic assignments.
