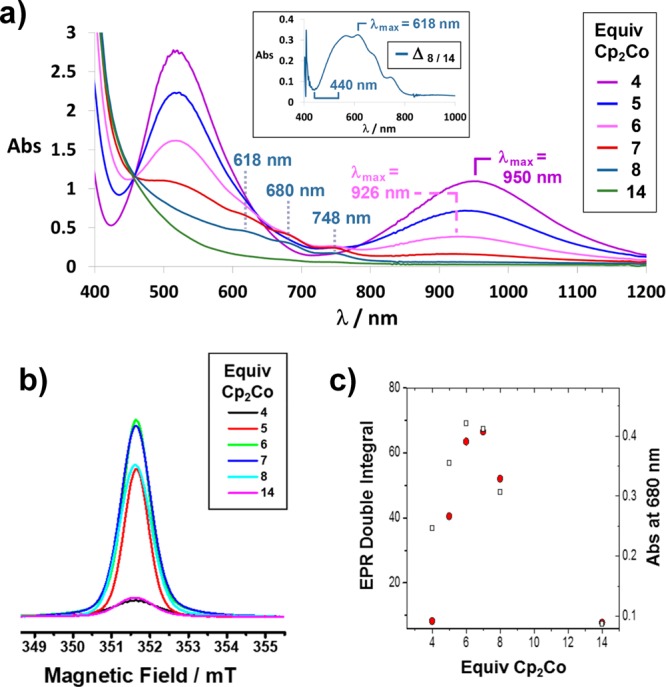
Figure 5.

(a) UV–vis–NIR spectra of a 0.33 mM (initial concentration) solution of BBR·8PF6 in Me2CO following the additions of 4, 5, 6, 7, 8, and 14 equiv of Cp2Co. The inset depicts the difference between the spectra obtained after adding 8 and 14 equiv of Cp2Co, with the latter spectrum scaled appropriately to account for different concentrations of the fully reduced viologen units in each sample. (b) Relative integrated EPR signal intensities of 0.25 mM solutions of BBR·8PF6 in Me2CO after the additions of 4, 5, 6, 7, 8, and 14 equiv of Cp2Co. See Figure S34 for the full EPR spectra. (c) Comparison of the relative integrated EPR signal intensities (red circles) with the visible light absorption of these samples at 680 nm (squares) that was measured by UV–vis–NIR spectroscopy.
