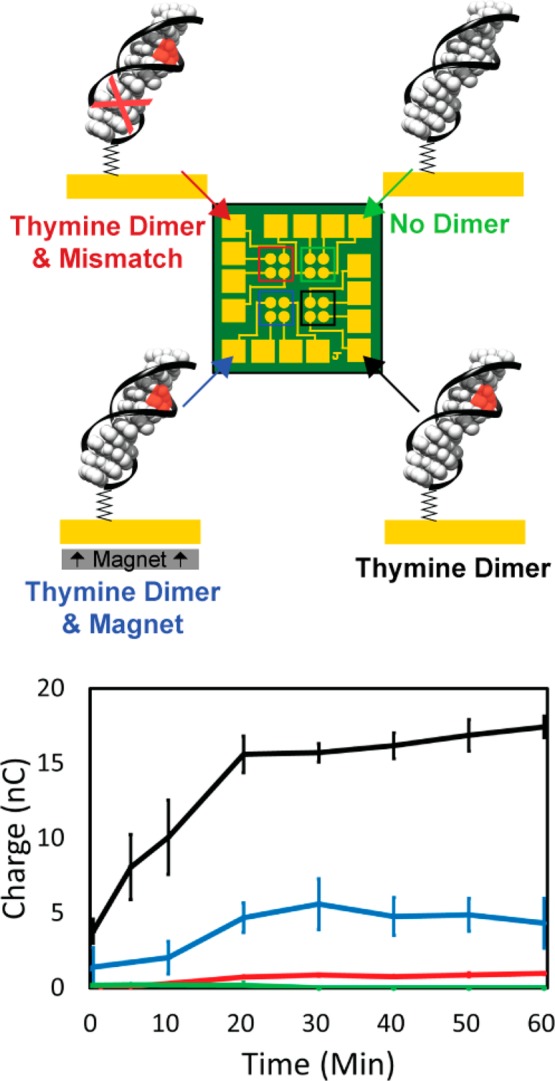
Figure 2.

Integrated cyclic voltammetry measurement of a representative multiplexed chip over time irradiated. (Top) Representation of the multiplexed chip and the different duplex DNA monolayers and experimental conditions that were tested. (Bottom) Plot of the area under the reductive peak, which gives the total amount of charge transferred to the flavin, over time irradiated. The color of traces corresponds to the quadrants shown in the representation above. In each case, 50 μM photolyase was added and irradiated with blue light at t = 0 anaerobically in Tris buffer (50 mM Tris-HCl, 50 mM KCl, 1 mM EDTA, 10% glycerol, pH 7.5). In the green quadrant, the 29 bp dsDNA contained no thymine dimer. In the red quadrant, the 29 bp dsDNA contained a thymine dimer and a C:A mismatch between the dimer and the electrode surface. In the black quadrant, the 29 bp dsDNA contained a thymine dimer. In the blue quadrant, the same 29 bp dsDNA containing a thymine dimer was used as was tested in the black quadrant, but the entire experiment was conducted with a 560 G magnetic field pointing perpendicularly up intersecting the plane of the electrode. Standard error was plotted with n = 4.
