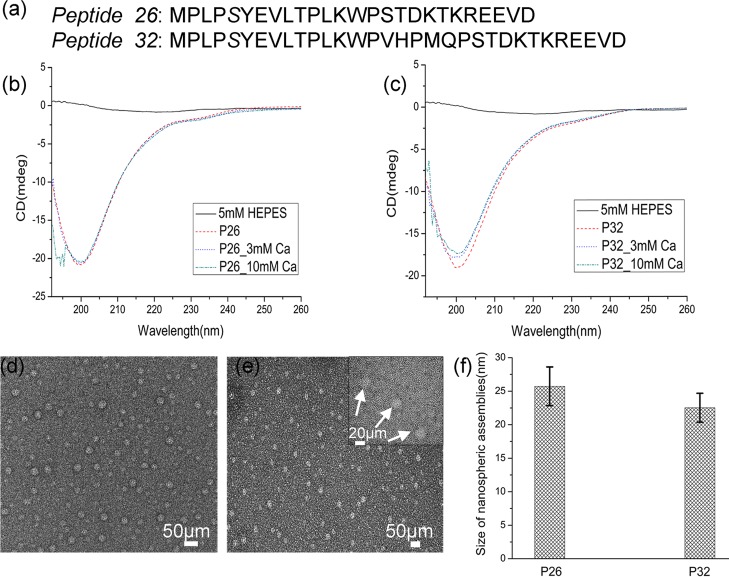
Figure 1.
Structural characterization of P26 and P32 peptides: (a) amino acid sequences of peptides P26 and P32. CD spectra of peptides (0.2 mg/mL); P26 (b) and P32 (c) in 5 mM HEPES pH 7.4 at 25 °C containing 3 and 10 mM Ca2+. TEM images of nanospheres formed from peptides P26 (d) and P32 (e) at pH 7.4 in HEPES buffer at 25 °C. The inset in (e) is a magnified image representative of uniformly dispersed spherical particles of peptides (white arrow) surrounded by a dense framework of threadlike nanostructures. (f) Average size distribution of the dispersed nanospheres for the two peptides calculated from the TEM images in (d,e), n = 50.

