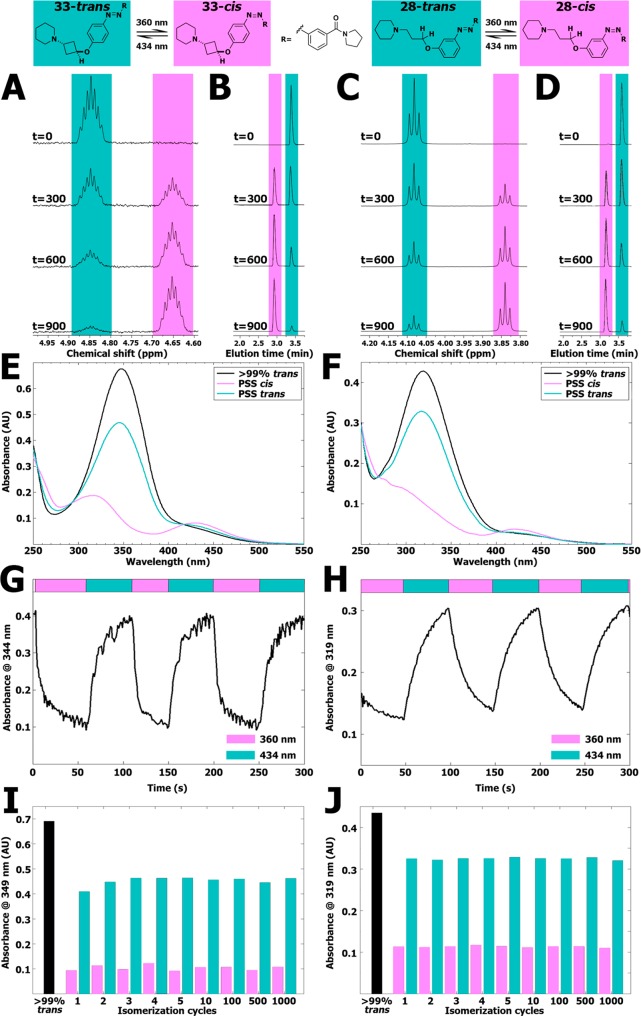
Figure 2.
(A) Representative part of 1H NMR spectra of 10 mM of compound 33 in DMSO-d6 illuminated at 360 ± 20 nm displayed at various time points (seconds). The presented peak belongs to the hydrogen atom explicitly drawn in the structure shown above the spectrum. Full 1H NMR spectra are available in Figure S18. (B) Representative part of LC–MS chromatograms belonging to the illuminated NMR samples shown in Figure 2A. The full chromatograms are available in Figure S19. (C) Representative part of 1H NMR spectra of 10 mM of compound 28 in DMSO-d6 illuminated at 360 ± 20 nm displayed at various time points (seconds). The presented peak belongs to the hydrogen atom explicitly drawn in the structure shown above the spectrum. Full 1H NMR spectra are available in Figure S20. (D) Representative part of LC–MS chromatograms belonging to the illuminated NMR samples shown in Figure 2C. The full chromatograms are available in Figure S21. (E) UV–vis spectra of 25 μM of compound 33 (trans) in 50 mM Tris–HCl pH 7.4 buffer containing 1% DMSO-d6. PSS cis represents a sample which has been illuminated for 300 s using 360 ± 20 nm light. PSS trans represents subsequent illumination for 300 s using 434 ± 9 nm. (F) UV–vis spectra of 25 μM of compound 28 (trans) in 50 mM Tris–HCl pH 7.4 buffer containing 1% DMSO-d6. PSS cis represents a sample which has been illuminated for 300 s using 360 ± 20 nm. PSS trans represents subsequent illumination for 300 s using 434 ± 9 nm. (G) Absorbance at 344 nm of 25 μM of compound 33 in 50 mM Tris–HCl pH 7.4 buffer +1% DMSO-d6. UV–vis spectra were obtained with 1 s intervals under alternating illumination with 360 ± 20 nm and 434 ± 9 nm perpendicular to the light source of the UV–vis spectrometer. (H) Absorbance at 319 nm of 25 μM of compound 28 in 50 mM Tris–HCl pH 7.4 buffer +1% DMSO-d6. UV–vis spectra were obtained with 1 s intervals under alternating illumination with 360 ± 20 nm and 434 ± 9 nm perpendicular to the light source of the UV–vis spectrometer. (I) Repeated isomerization cycles of 25 μM of compound 33 in a pH 7.4 buffer containing 15 mM HEPES, 64 mM NaCl, 25 mM KCl, 0.4 mM CaCl2, and 0.8 mM MgCl2 containing 1% DMSO-d6 analyzed at 349 nm. PSS cis was obtained by using illuminations for 20 s at 360 ± 20 nm. PSS trans was obtained by using illuminations for 20 s at 434 ± 9 nm. An extended figure is available in Figure S16. (J) Repeated isomerization cycles of 25 μM of compound 28 in a pH 7.4 buffer containing 15 mM HEPES, 64 mM NaCl, 25 mM KCl, 0.4 mM CaCl2, and 0.8 mM MgCl2 containing 1% DMSO-d6 analyzed at 319 nm. PSS cis was obtained by using illuminations for 20 s at 360 ± 20 nm. PSS trans was obtained by using illuminations for 20 s at 434 ± 9 nm. An extended figure is available in Figure S17.

