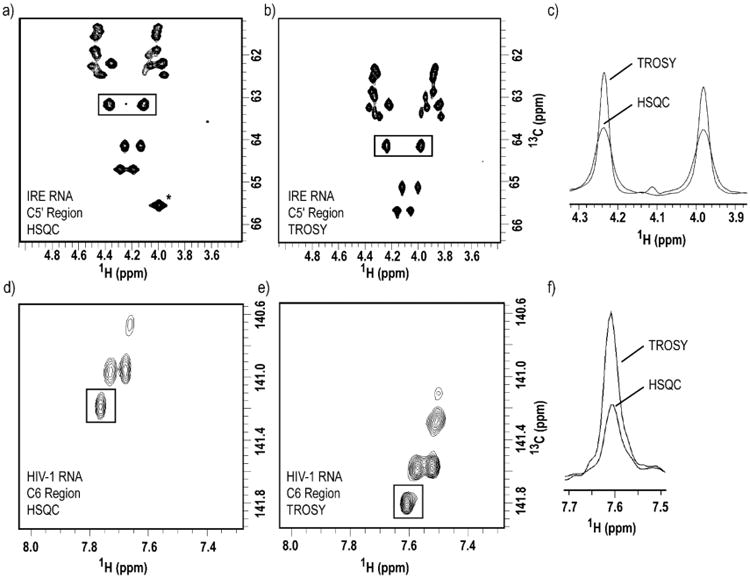
Figure 7.7.

TROSY spectra acquired with RNA samples labeled with site-specific labels produced by chemo-enzymatic synthesis exhibit enhanced resolution and sensitivity than HSQC experiments. Two-dimensional (a) HSQC vs. (b) methylene-optimized TROSY spectra of 1′,5′,6-13C3-1,3-15N2-UTP/1′,5′,6-13C3-1,3,4-15N3-CTP-labeled IRE RNA. (c) One-dimensional slice overlay of the boxed peaks in both (a) and (b), notice the spectral quality enhancement due to the TROSY effect. Two-dimensional (d) HSQC vs. (e) methine-optimized TROSY spectra of 1′,5′,6-13C3-1,3-15N2-UTP-labeled HIV-1 RNA. (f) Overlay of one-dimensional slice of the boxed peak in both (d) and (e), notice the spectral quality enhancement due to the TROSY effect. For IRE RNA, the spectral width used were 3597 Hz and 905 Hz in the 1H and 13C dimensions, respectively. 1024 and 256 complex points were acquired in t2 and t1, respectively, with 8 scans per slice. For HIV-1 RNA, the spectral width used were 3597 Hz and 754 Hz in the 1H and 13C dimensions, respectively. 512 and 128 complex points were acquired in t2 and t1, respectively, with 128 scans per slice. * Peak is not shown in (b) due to the resonance offset in TROSY experiments.
