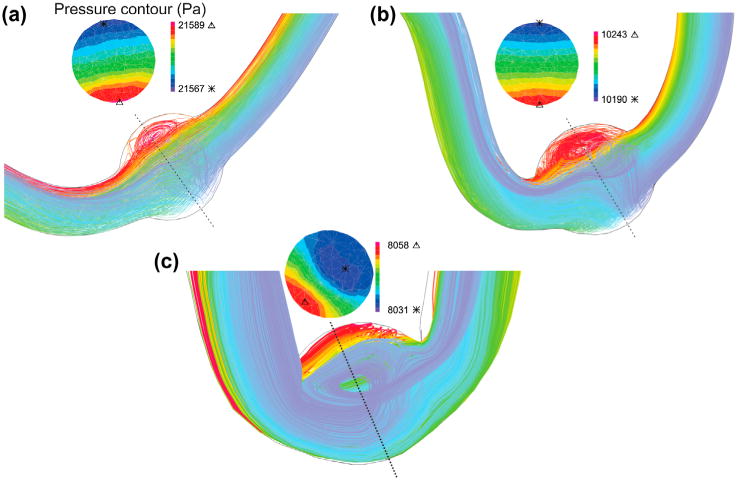
Figure 7.

Particle trace plots of the pathlines and pressure contours at the maximum deflection area for the aneurysmal artery under pulsatile flow with a stretch ratio of 1.5 for a mean pressure of: (a) aneurysmal carotid artery with Pm = 60 mmHg (b) aneurysmal carotid artery with Pm = 130 mmHg (c) aneurysmal abdominal aorta with Pm = 40 mmHg.
